Varroa mites pose a serious threat to honeybee colonies by multiplying fast and spreading viruses through the hive.
Monitoring mite levels gives beekeepers clear information about infestation and helps guide treatment decisions.
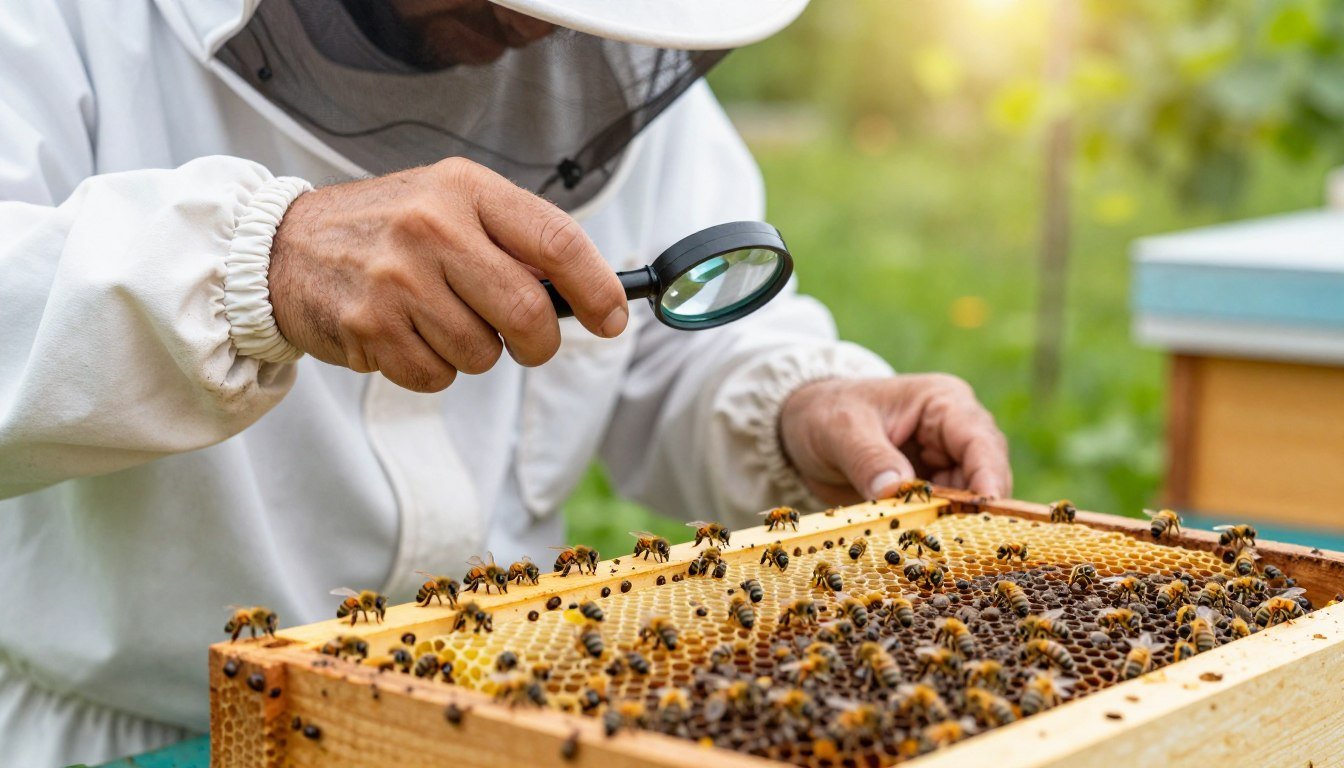
Standard sampling takes about 300 nurse bees — roughly a 1/2 cup from brood frames with open larvae. An alcohol wash or sugar roll yields similar results for a reliable count.
Knowing the number of mites per 100 bees is the first step in setting a response. If tests show more than three mites per 100 bees, consider treatment soon to protect the colony.
Consistent testing through the season reveals trends and helps catch spikes in population. For practical guidance on monitoring and timing, see this monitoring guide.
Key Takeaways
- Varroa mites spread viruses and can quickly harm a hive.
- Sample about 300 bees (≈1/2 cup) from brood frames for accurate results.
- Use an alcohol wash or sugar roll; both give comparable counts.
- Treatment should be considered above 3 mites per 100 bees.
- Repeat tests through the season to track mite levels and protect colonies.
The Importance of Consistent Mite Monitoring
Consistent monitoring turns sporadic observations into actionable data for strong colonies. Regular checks reveal trends in infestation that single inspections miss. This is essential for winter readiness and long-term health.
Routine testing is the only reliable way to confirm that a chosen treatment is working. Keep a simple log of results and dates. Over time, those entries show whether treatments reduce mites and protect bees.
Even during cold months, low activity in the hive does not mean zero risk. Varroa can persist and undermine survival if left unchecked.
“Data-driven checks let beekeepers act early, rather than react after losses.”
- Track readings each season to spot rises in infestation.
- Use records to judge treatment success and plan follow-up.
- Understand the varroa life cycle so interventions match pest biology.
For practical thresholds and monitoring methods, see understanding mite thresholds and guidance on post-treatment monitoring.
How to Compare Mite Counts Across Apiary Yards
Using the same test protocol in every hive removes guesswork and highlights real differences in infestation. Good information lets beekeepers make clear treatment choices for colonies that need help.
Alcohol wash vs. sugar roll: Both methods work, but the alcohol wash dislodges mites more effectively and often gives a higher, more accurate count. Use a 300-bee sample — roughly a 1/2 cup of bees from brood frames — for either method.

Standardizing Sample Sizes
Take 300 bees from nurse frames every time. After counting total mites, divide by three for mites per 100 bees. Lewis Cauble, an NCDA&CS inspector, collected early June samples and found 66% of colonies below the 3-per-100 threshold; 14% fell between 3–4; four colonies had high loads at 7, 11, 14, and 17.
- Record each reading in a journal and note spring and summer trends.
- Isolate hives with high levels and act quickly on treatment decisions.
- If queen problems exist, add a brood frame to assess replacement capacity.
For step-by-step guidance on the alcohol wash, see this alcohol wash guide.
Interpreting Thresholds and Seasonal Variations
Thresholds change with the calendar and local brood cycles. From April through July, aim for a treatment threshold of 2 mites per 100 bees. In many regions that is the window when brood is abundant and reproduction is rapid.
From August through October the recommended threshold rises to 3 per 100 bees. Fall brings fewer brood frames, and more phoretic mites ride adult bees, so acceptable numbers shift.
Adjusting for Local Brood Cycles
Local climate and floral timing affect brood breaks. If your area lacks a clear northern-style brood pause, move treatment timing earlier or later to match colony growth.
- Use a 300-bee standard test (about a 1/2 cup) to calculate mites per 100 bees and compare to thresholds.
- Track readings monthly through the active season; varroa populations can spike rapidly as bee numbers shift.
- If results exceed 3 per 100 bees, apply a prompt treatment to protect the colony.
“Good records let beekeepers spot trends before low-level infestation becomes colony loss.”
For step-by-step guidance on management timing and measurement, consult the management guide and an illustrated alcohol wash reading at reading an alcohol wash.
Utilizing Sticky Boards for Low-Impact Assessment
Bottom-board monitoring provides a noninvasive snapshot of mite pressure over a set period. Sticky boards, or screened monitoring trays, let fallen pests accumulate so you can estimate infestation without opening the brood.

This method is gentle on the bees and useful year-round. Place a clean tray under the hive and check after 24 hours or a 3-day run. For a three-day span, divide the total by three for the daily average.
- Low impact: Little disturbance while you watch natural mite fall and track sudden changes in levels.
- Quick screen: A 24-hour count gives a rough estimate; a three-day count smooths daily variation.
- Be careful: Debris can mimic mites, so inspect closely. If counts exceed about 8 per 24 hours in spring or 12 in fall, follow up with a more accurate test like an alcohol wash.
Keep the bottom board clean before each run and log readings over time. For background on reconnaissance sampling and sticky-board use, see reconnaissance sampling.
Advanced Resistance Testing for Treatment Efficacy
Resistance checks confirm whether a chosen acaricide still knocks down varroa. Lewis Cauble ran tests after noticing poor control with ApiVar (amitraz). Simple field assays give clear numbers rather than guesswork.
Identifying Amitraz Resistance
Place a 1/2 cup of bees in a ventilated container with a glued ApiVar square. Flip the container over a plate coated with petroleum jelly and wait 3 hours.
Setting Up Resistance Tests
- Collect 1/2 cup bees from nurse frames and secure the lid.
- Use #8 hardware cloth for ventilation and position the plate beneath.
- Run the test for 3 hours, then wash the bees with alcohol or sugar roll to find remaining mites.
Evaluating Efficacy Results
Calculate efficacy: susceptible mites on plate ÷ (plate mites + wash mites). Targets: 70% or higher means effective. Below 70% signals resistance—Colony 80 showed only 4.2% efficacy.
“Run resistance tests before treating; records guide better rotation and winter plans.”
| Step | Action | Why it matters |
|---|---|---|
| Sample | 1/2 cup bees | Standardizes population for fair comparison |
| Run | 3 hours over jelly plate | Collects susceptible mite fall |
| Calculate | Plate ÷ (plate + wash) | Quantifies efficacy; 70% threshold |
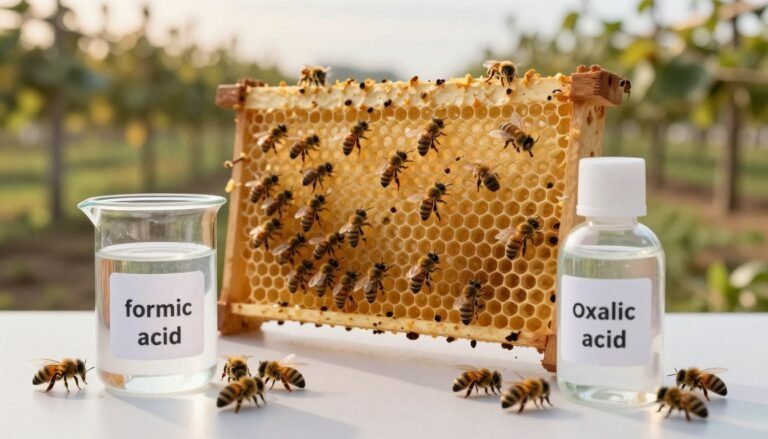
| Follow-up | Rotate treatments (e.g., oxalic acid in winter) | Reduces resistance risk |
Proactive Management and Integrated Pest Management
Building an IPM plan means preparing treatments, records, and timing long before a crisis. Integrated Pest Management (IPM) helps beekeepers act early and keep varroa pressure low across the year.
Plan ahead: have approved treatments on hand, know local seasonal growth patterns, and schedule regular checks. Monitor every colony rather than relying on a few samples. Sub-sampling can miss a single hive with a high load.
After testing, give bees 2–3 days to recover before applying any chemical treatment. This pause reduces stress and improves treatment uptake when needed.

- Record keeping: log readings, queen performance, and problems each season.
- Local guidance: consult your state agency or club for region-specific thresholds and timing.
- Tools: timed drone frames, sugar rolls, and treatment supplies belong in a ready kit.
“A well-planned IPM program gives beekeepers the information needed for long-term colony health.”
For a practical IPM primer, read an integrated pest management overview. For selection advice between chemical options, review a side-by-side on treatment options.
Conclusion
Steady monitoring converts raw readings into timely actions that protect colonies.
Keep a simple, regular testing plan and record each result. Use reliable methods like the alcohol wash sampling and sugar roll for accurate assessment.
Match thresholds to local brood cycles and adjust treatment timing based on seasonal trends. Run resistance checks when treatments seem less effective and rotate products as needed.
For long-term improvement, pair records with selective-breeding insights found in this selective breeding update. Clear logs and proactive management preserve colony health and productivity.
FAQ
What’s the simplest field test for estimating varroa levels?
The alcohol wash and sugar roll are the two most common tests. The alcohol wash kills and dislodges mites for an accurate count. The sugar roll keeps bees alive and provides a quick estimate. Use a standardized sample size—typically 300 bees—for consistent results. Record date, colony ID, and season when logging results.
Why use the same sample size for every hive?
Consistent sample sizes reduce variability and make comparisons meaningful. Larger samples lower statistical error and smaller samples increase chance variation. Aim for about 300 adult bees taken from the brood area during spring or summer for comparable infestation estimates.
How do sticky boards fit into a monitoring plan?
Sticky boards offer low-impact monitoring by collecting natural mite drop over 24 to 72 hours. Place them under screened bottom boards and count mites per day. This method complements wash or roll tests and helps detect trends without handling bees.
What seasonal factors affect mite counts?
Brood levels, colony population, and forage cycles change through spring, summer, and fall. Mites reproduce inside brood cells, so counts often rise during heavy brood periods. Winter brings deceptive lows; treatment timing should account for late-season population surges and overwintering risks.
How should thresholds guide treatment decisions?
Thresholds vary by season and management goals. Common action levels are 2–3% infestation in spring/summer based on a 300-bee sample, or specific mite drops per day on sticky boards in late season. Combine counts with colony strength and virus symptoms before applying treatment.
Can I compare counts between different apiaries in my region?
Yes, but only if testing methods, sample sizes, and timing are standardized. Compare data collected within the same season and from similar colony types. Adjust for brood presence and local environmental differences like forage and weather patterns.
What steps improve inter-yard data reliability?
Use the same test method, sample size, and collector technique across yards. Train assistants to sample from the brood nest consistently. Log date, time, weather, and recent treatments. Regular sampling intervals—every 2–6 weeks—reveal trends and treatment impact.
How do I assess treatment efficacy after applying miticides?
Run wash or roll tests and sticky-board counts before treatment and again 7–14 days after application, depending on product label. A clear drop in mite numbers indicates efficacy. For miticides like oxalic acid or formic acid, follow label timing and monitor brood cycles for best results.
What about detecting chemical resistance, such as to amitraz?
Resistance testing combines pre- and post-treatment counts with controlled exposure assays. If mite levels don’t fall after correct application, consider sending samples to a lab for bioassay or consult state apiarist services. Rotate products and integrate non-chemical options to slow resistance.
How should beekeepers factor brood into infestation estimates?
Because mites hide in brood, adult-bee counts underestimate total colony infestation when brood is abundant. Estimate total pressure by combining adult-bee sample results with brood assessments. In heavy-brood periods, use tighter thresholds and consider brood interruption tactics.
Are there nonchemical tactics that reduce population pressure?
Yes. Requeening with hygienic queens, creating brood breaks, using screened bottom boards, and drone brood removal all reduce mite reproduction. Combine these with timely monitoring and targeted treatments for best results under integrated pest management principles.
How often should I test during high-risk periods?
During active brood and nectar flows, test every 2–4 weeks. In late summer and fall, increase monitoring to every 1–3 weeks to prevent winter buildup. More frequent checks help catch rapid population increases and time interventions before overwintering.
What records should I keep for long-term comparisons?
Maintain a log with colony ID, test method, sample size, mite counts, date, treatment history (product, dosage, date), queen age, and notes on brood or virus symptoms. Aggregated multi-year records reveal patterns and help refine thresholds and treatment plans.
Can sugar roll results be converted to percent infestation like alcohol wash?
Sugar roll and alcohol wash produce comparable percent infestation when protocols match. Both count mites per sample of bees; divide mite number by bee count and multiply by 100. Expect slightly lower recovery with sugar roll, so adjust thresholds or use alcohol wash for critical decisions.
What are acceptable post-treatment declines in mite numbers?
Effective treatments typically reduce counts by 80–95% depending on product and application timing. If counts fall less than expected, check application method, dosage, and possible resistance. Follow-up testing at two weeks and again at one month provides a clear picture.