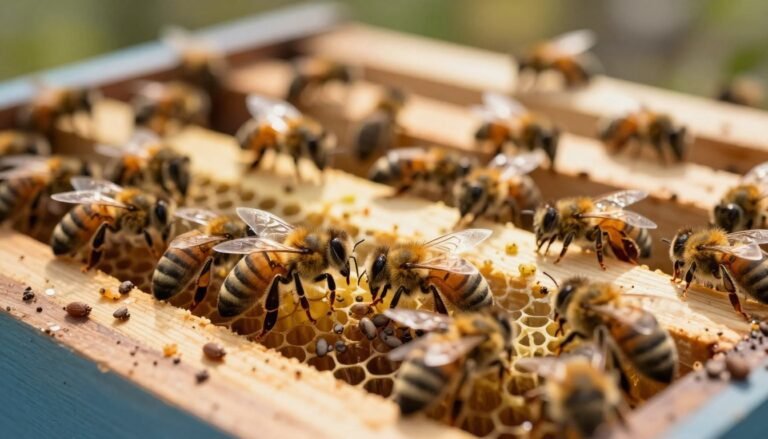
Varroa destructor are external parasites that feed on the body fluids of adult and developing honey bees. These mites measure roughly 1.0 to 1.5 mm in length and resemble a tiny sesame seed.
Left untreated, infestations usually lead to complete colony loss. Regular monitoring is essential to protect hive health and to time interventions before populations reach damaging levels.
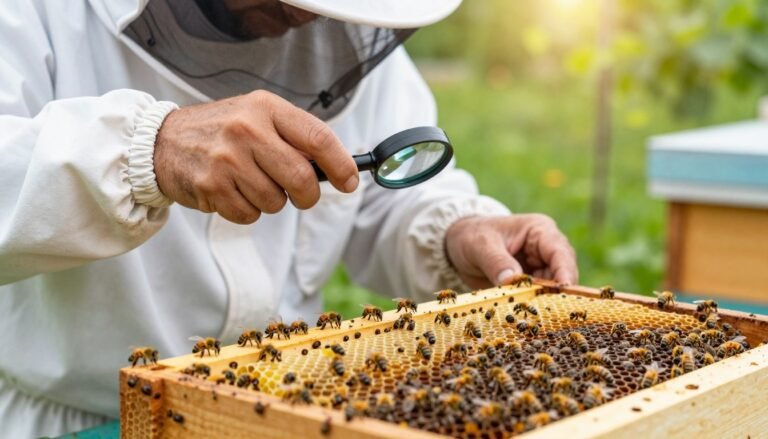
Provincial Apiarist Paul Kozak stresses that measurement and record-keeping guide good management. Beekeepers who track results can make informed choices about treatments and timing.
Using a sticky board varroa count chart helps quantify infestation and shows trends over the season. This practical tool makes it easier to spot rising mite pressure and act before the colony weakens.
Key Takeaways
- The Varroa destructor is the top threat to honey bee colonies and can cause collapse if ignored.
- These mites are small—about 1.0–1.5 mm—so careful inspection and sampling matter.
- Consistent monitoring lets beekeepers detect infestations early and avoid severe damage.
- Paul Kozak and provincial guidance emphasize regular checks and good record keeping.
- The sticky board varroa count chart provides clear, actionable data for treatment decisions.
Understanding the Threat of Varroa Mites
A rising mite population undermines colony strength long before visible collapse occurs.
The mite is an external parasite that feeds on the body fluids of adult and developing honey bee workers. These tiny arachnids are darkish red and have eight small legs near the front of their body.
Most mites concentrate in the brood nest and reproduce inside brood cells. When numbers grow, they spread to adult bees and carry viruses that damage developing bees.
Biology and Life Cycle
Females enter brood cells just before capping and reproduce while the pupa develops. After emergence, offspring move onto adult bees and increase the population across the colony.
Impact on Honey Bee Colonies
Heavy infestations often bring deformed wing virus and reduced worker lifespans. You may see sick bees crawling at the entrance or poor brood patterns in spring and summer.
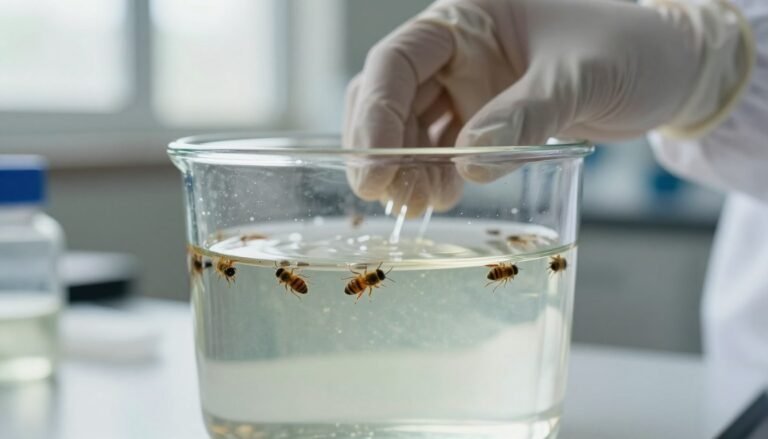
Beekeepers use several sampling methods to measure infestation. An alcohol wash is one standard diagnostic tool to get reliable results and estimate mite levels quickly.
“Monitoring the population of these mites is critical; prompt action prevents rapid colony decline.”
For practical monitoring tips, see monitoring mites with a sticky board.
Why Monitoring is Essential for Colony Health
Routine sampling gives beekeepers the evidence they need to act before damage spreads. Regular monitoring shows whether mite numbers remain below the economic injury level and helps time any necessary treatment.

Mite populations shift with the season. In spring and summer, heavy brood rearing fuels rapid population growth. Without checks, an unnoticed rise can reduce honey yields and worsen wintering success.
Accurate methods—like an alcohol wash or the ether roll—give reliable results. The roll method is fast but requires careful handling and distance from the hive to avoid agitation.
- Early detection prevents viral outbreaks and colony decline.
- Regular checks throughout the year keep population levels manageable.
- Data-driven decisions mean treatments are used only when needed.
Consistent monitoring is the cornerstone of responsible apiary management and protects bees, brood, and honey production over the long term.
Essential Tools for Your Sticky Board Varroa Count Chart
A reliable set of tools makes mite monitoring faster and more accurate for every beekeeper.
Start with a screened bottom to keep bees off the adhesive surface and prevent removal of mites. Fit a 1/8 inch hardware cloth or wire mesh above the pan so the colony cannot reach the coating.
Tangle-Trap Insect Trap Coating is the common adhesive used to capture mites as they fall. A magnifying glass helps identify tiny mites and separate debris from true mite drops.
- Notebook and pen for logging results, dates, and any treatment applied.
- Magnifier for accurate counts and verification against other methods like an alcohol wash or roll.
- Hardware cloth to protect the surface while allowing mite fall.
| Tool | Purpose | Recommended | Notes |
|---|---|---|---|
| Screened bottom | Keeps bees off adhesive | 1/8″ hardware cloth | Essential for clean results |
| Adhesive pan | Captures mite fall | Tangle-Trap coating | Apply thin, even layer |
| Magnifying glass | Identifies mites | 10x hand lens | Use in good light |
| Notebook | Records results | Weatherproof notebook | Track trends by season |
Good gear plus consistent logging turns raw numbers into useful data. That helps you spot rising mite population and plan treatment before honey yields or brood suffer.
Preparing Your Sticky Board for Deployment
A simple preparation step will improve the accuracy of your mite monitoring and save time in the apiary. Gather your materials and plan a clean workspace so results are reliable.
Selecting adhesive materials
Cut a heavy letter-size folder to 40 x 29.5 cm to make a durable sampling surface. Apply a thin, even layer of Tangle-Trap, or use a homemade mix of Crisco and vegetable oil or petroleum jelly as an alternative.
Use the adhesive sparingly so mites remain visible and debris does not obscure the surface. A light, uniform coat gives the best results across the pan.

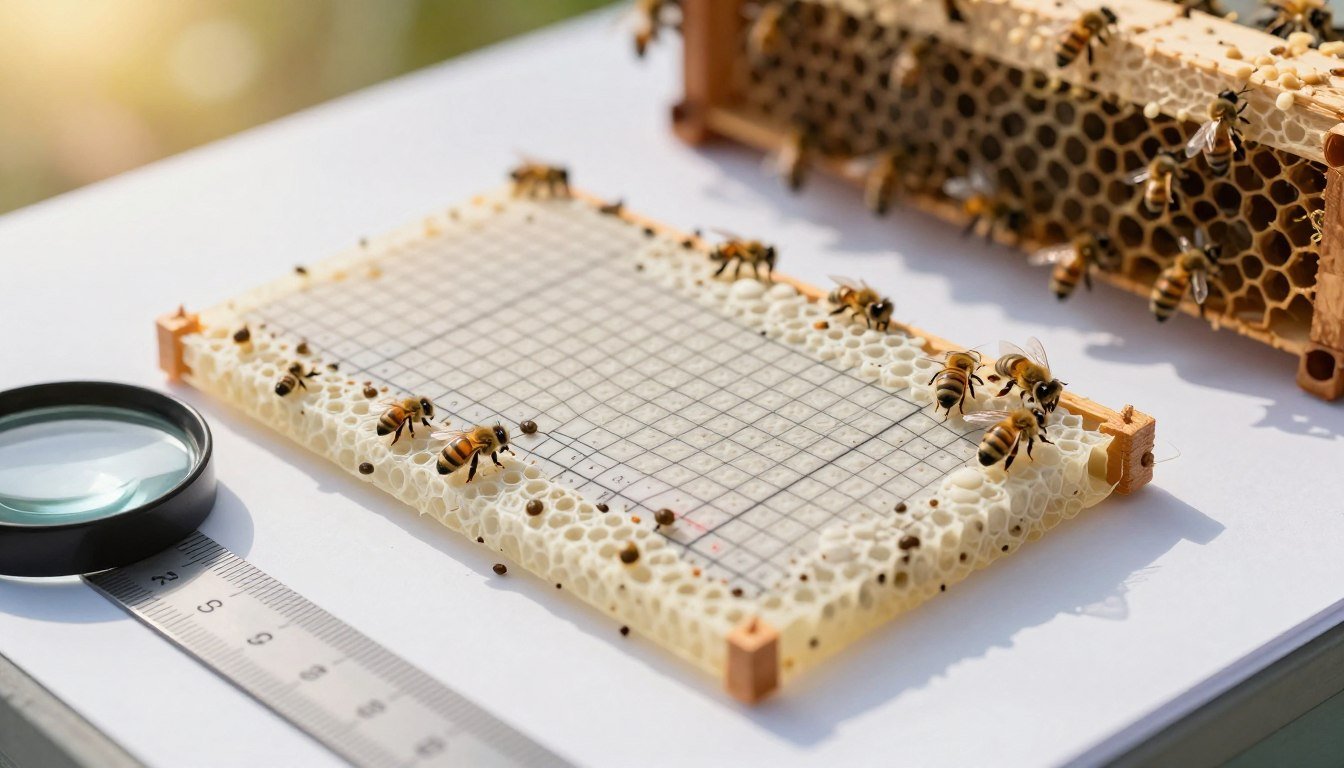
Creating the counting grid
Mark a grid on the panel to break the surface into manageable sections. Number the squares and write the colony number on the tab for accurate record keeping when you manage many colonies.
Place the pan beneath the brood chamber and over a screened bottom to stop honey bees from walking on the adhesive and removing fallen mites. This placement captures the highest concentration of mite fall from the brood area.
“Well-made preparation turns a simple pan into a dependable measure of colony mite pressure.”
- Cut paper to 40 x 29.5 cm and mark a counting grid.
- Use Tangle-Trap or a Crisco/vegetable oil mix applied evenly.
- Place the pan under the brood chamber and label with the colony number.
- Always use a screened bottom so bees cannot disturb the adhesive surface.
For time-saving tips when monitoring multiple hives, see time management for multi-hive apiaries.
How to Properly Install the Sticky Board
Slide the prepared pan gently under the brood chamber so natural mite fall collects without disturbing the colony.
Use a screened bottom board when possible. Fit the pan beneath the brood frames and above the screen so bees cannot reach the adhesive. This placement captures mites that drop from nurse bees and brood areas.
If you lack a screen, place 1/8 inch hardware cloth directly over the pan. That mesh protects the surface from bee activity while still letting mite fall through to the pan below.
Transport prepared pans on serving trays to the bee yard. Set trays flat and stack them alternately in a box for safe transit. This keeps the adhesive clean and prevents smearing before installation.
- Slide the pan carefully beneath the brood chamber using a screened bottom board when available.
- If no screen exists, place 1/8″ hardware cloth over the pan to protect it from bees.
- Use serving trays to move pans and stack trays alternately in a box for secure transport.
- Correct installation ensures the pan records natural mite fall and produces reliable results for monitoring.
“Proper placement and gentle handling are the keys to accurate monitoring and better treatment decisions.”
Determining the Optimal Monitoring Duration
Monitoring over several days smooths out the swings in daily mite fall and gives a clearer picture of hive pressure.

Collecting boards after 24, 48, or 72 hours is common. A 72-hour period is recommended because it evens out daily variation in mite drop.
Three days gives a more reliable average of mite fall than a single-day sample. This helps beekeepers spot trends in the mite population and judge infestation levels before viruses or brood damage rise.
Practical steps for consistent monitoring
- Use a new board for each sampling period to avoid cross-contamination.
- Divide the total mites on the pan by the number of days to get a daily average for comparison against treatment thresholds.
- Repeat monitoring by season—spring, summer, and fall—to track population changes over the year.
| Sampling Period | Use New Board | Daily Average Method | Best For |
|---|---|---|---|
| 24 hours | Yes | Total ÷ 1 | Quick checks, high activity |
| 48 hours | Yes | Total ÷ 2 | Moderate reliability |
| 72 hours | Yes | Total ÷ 3 | Most reliable average |
“A three‑day monitoring window gives the beekeeper better confidence in results and timing for any needed treatment.”
Interpreting Your Sticky Board Results
Look at results as part of a trend, not a single verdict. One-day spikes can mislead. Compare the pan totals over several sampling periods to see whether mite pressure is rising or stable.
High numbers on the pan usually point to a severe infestation and call for prompt action. Remember that the drop shows mites that have fallen — it does not count mites still on adult bees.
The readings can vary with colony size and grooming by the bees. A large hive may shed more mites simply because there are more hosts. Likewise, colonies that groom well may show lower pan drops even with a sizable internal population.

Use another method to confirm when results are ambiguous. An alcohol wash or roll can estimate mites on bees and help you judge total infestation before treating.
“By tracking drops across the season and comparing methods, beekeepers can time treatments and protect brood and honey.”
- High pan totals often mean a larger remaining population on the adult bees.
- Low but consistent drops can indicate early infestation — treat before levels rise.
- Compare pan results over spring, summer, and fall to assess control efforts.
For detailed sampling guidelines and to align your monitoring with best practices, consult this sampling protocol.
Calculating Daily Mite Fall Averages
Converting total mite fall into a 24‑hour average makes comparisons reliable across seasons. To get the daily average, divide the total mite drop by the number of days the pan stayed under the hive.
For example, if you count 36 mites after 72 hours, divide 36 by 3 to get 12 mites per 24 hours. That single figure is easier to compare between colonies and across sampling periods.
Why this matters: the daily average is the standard metric beekeepers use to compare results against treatment thresholds. Accurate math helps decide if a treatment is needed now or if more monitoring is acceptable.
“Record the daily average in your logbook to spot upward or downward trends in the mite population.”
- Divide total drop by the number of sampling days to get the daily figure.
- Use the daily average to compare colonies, seasons, and methods like alcohol wash or roll.
- Keep consistent records so you can detect increases in infestation and act in time.
Comparing Sticky Boards to Other Sampling Methods
How you sample mites affects both accuracy and the impact on the bees themselves.
Alcohol wash and the ether roll give immediate results in one visit. They require a standard sample of about 300 bees, which helps compare infestation levels between colonies quickly.
Boards do not kill any bees and are useful over several days. They also let beekeepers track mite drop while a chemical treatment is in place to gauge efficacy.
Each method has tradeoffs. Wash and roll are fast and precise but remove bees. Passive sampling is gentler but needs multiple days for reliable averages.
“Choose the method that matches your need for speed, accuracy, and colony welfare.”
| Method | Speed | Colony Impact | Best Use |
|---|---|---|---|
| Alcohol wash | Immediate | Removes ~300 bees | Standardized comparisons |
| Ether roll | Immediate | Removes bees; quick field check | Rapid diagnosis |
| Passive sampling | 24–72 hours | No bee mortality | Monitor treatment and long-term trends |
- Practical tip: Use a wash to confirm high drops from passive pans.
- Weigh your need for instant results against preserving colony population.
Establishing Treatment Thresholds for Your Apiary
Define treatment levels for each season to guide timely decisions in your apiary.
Current practical thresholds help standardize when to act.
- Treat when a sticky pan shows more than 9 mites per 24 hours in May.
- By August, the action level rises to 12 mites per 24 hours due to seasonal growth.
- Use an alcohol wash as a confirmatory test: 2 mites per 100 bees in May, 3 per 100 in August.
- An ether roll threshold is tighter: 1 mite/100 bees in May and 2/100 in August.
Experts have lowered these levels recently to protect honey bees and reduce virus risk.
Best practice: monitor regularly, compare your pan and wash results, and treat when either method crosses its threshold.
“Use consistent monitoring and set numeric triggers to keep colonies healthy.”
For supplemental, non-chemical options and integrated strategies see natural remedies for varroa mites.
Best Practices for Seasonal Sampling
Regularly timed tests are the most practical way to track infestation and time treatment effectively.
Beekeepers should sample at least twice a year: once in early spring and again in late summer. These two checks catch seasonal rises in mite population and protect developing brood.
Mid‑summer sampling is wise if a hive looks weak or stressed. A mid‑season check can reveal a sudden rise in mites or a viral problem and prompt timely treatment.
Always sample before and after any treatment. Comparing results shows whether the intervention lowered the mite population and if follow‑up action is needed.
Sample across every beeyard. Individual colonies vary, so test several hives per yard when you cannot test all. This gives a reliable picture of apiary health over the season.
“Consistent seasonal monitoring keeps the beekeeper ahead of the mite life cycle and reduces virus risk.”
- Test early spring and late summer as a baseline each year.
- Add mid‑summer checks when colonies show stress.
- Sample before and after any treatment to confirm success.
- Cover every yard by sampling multiple hives for representative results.
For practical control options and integrated strategies, review varroa mite control methods to match your monitoring plan with effective interventions.
Managing Re-infestation Risks
Re-infestation can arrive quickly from neighboring apiaries, undoing recent gains.
Colonies often pick up new mites from surrounding hives or feral sources. Even after a successful treatment, beekeepers must keep testing to catch fresh arrivals early.
Use a regular schedule of monitoring with sticky boards after treatment to spot any sudden spike in mite drop. A clear record of daily pan results helps identify trends and signals when follow‑up treatment is needed.
Managing re‑infestation is a core part of integrated pest management. Maintain perimeter checks, inspect nearby apiaries if possible, and consider coordinated treatments with neighboring owners when infestations are widespread.
“Ongoing vigilance after treatment prevents a return to high mite population and protects brood and honey production.”
- Keep sampling for several days after treatment to confirm success.
- Compare pan results with an alcohol wash or roll when numbers are unclear.
- Act quickly on rising mite numbers to protect the colony and surrounding colonies.
Maintaining Accurate Beekeeping Records
Good record keeping reveals subtle shifts in mite pressure before hives show obvious signs of stress. A clear logbook lets a beekeeper compare seasons and judge the effectiveness of treatments.
- Date of sampling: record the day and period (24/48/72 hours).
- Method used: note whether you used a pan, wash, or roll and which wash or alcohol solution if applicable.
- Mite numbers: log the drop or number per 100 bees and any averages you calculate.
- Treatments: list product names, application dates, and follow-up checks.
Compare current results with past years to spot trends in mites and colony strength. Detailed notes help you see if a treatment reduced the population or if reinfestation occurred after a few days.
For guidance on sampling methods that pair well with record keeping, review reconnaissance mite sampling to align your logs with best practices.
“A well‑kept record book is the beekeeper’s most reliable tool for professional colony management.”
Conclusion
A steady monitoring routine gives beekeepers the data they need to act with confidence.
Monitoring mite populations using a sticky board varroa count chart is a critical practice for every responsible beekeeper. Follow the standardized steps for preparation and placement to get reliable results and protect colony health.
Sample in spring and late summer, compare your daily averages with established treatment thresholds, and act promptly when levels rise. Keep clear, dated records of every test and treatment.
Consistent monitoring, timely intervention, and careful record keeping will help you manage infestation risk and preserve brood, honey yields, and wintering success.
FAQ
What is the best way to monitor mite levels in a honey bee colony?
Use a consistent monitoring method such as an alcohol wash, sugar shake, or screened pan drop. Each method has pros and cons: alcohol washes give accurate percentage infestation by counting mites per 100 bees, sugar shakes are less lethal and useful when brood is low, and a screened bottom with a collection pan tracks natural mite fall over time. Rotate methods seasonally to capture brood and adult mite dynamics and record results for trend analysis.
How often should I check mite levels during the beekeeping season?
Check mites at least every four to six weeks, and more frequently during spring buildup and late summer when populations peak. Post-treatment checks are essential two to four weeks after application. Increase sampling after heavy nectar flows, queen splits, or combining colonies to detect reinfestation quickly.
How many days should I leave a screened pan in place to get reliable mite fall data?
Leave the pan in place for a minimum of three days to smooth daily variation and get a representative fall rate. Shorter periods produce more noise from temperature, bee activity, and short-term brood cycles. A three-day span balances convenience with meaningful averages for management decisions.
What thresholds should trigger treatment decisions for honey bee colonies?
Use method-specific thresholds: for alcohol wash, many beekeepers treat at 2–3% mites (2–3 mites per 100 bees) during sensitive times; for natural mite fall, commonly used triggers range from 10–50 mites per day depending on season and colony strength. Adjust thresholds based on brood availability, colony population, and local virus pressure.
Can I rely on natural mite fall alone to assess infestation?
Natural mite fall provides useful trend data but can underestimate brood-associated mites because mites often hide in capped cells. Combine fall counts with alcohol washes or sugar shakes periodically to capture total infestation and reduce false negatives.
How do I calculate daily mite fall averages from a multi-day sample?
Divide the total mites collected by the number of days the pan was in place. For example, 45 mites over three days equals a 15-mite daily average. Use that average to compare against seasonal thresholds and historical colony records.
What materials work best for a collection pan under a screened bottom?
Use a shallow, light-colored pan with a fine mesh or light dusting material to prevent mites from rolling into crevices. Sticky materials are an option but can complicate counting. Clear plastic or metal pans with a removable liner simplify removal and counting while minimizing disturbance.
How should I prepare a grid for counting mites on a collection surface?
Draw a simple square grid on a removable liner or use a printed sheet sized to fit the pan. Number the squares for systematic scanning and to speed up counts. For large totals, count representative squares and extrapolate to the full surface for faster estimates.
What are common errors that lead to inaccurate mite monitoring?
Frequent mistakes include inconsistent sampling time, varying methods between checks, short deployment periods, and not accounting for brood levels. Environmental factors like wind or robbing can alter fall rates. Standardize your protocol and record conditions to improve reliability.
How does brood level affect mite monitoring and treatment timing?
High brood reduces the effectiveness of some treatments and masks true infestation because many mites hide inside capped cells. Monitor brood patterns and target treatments when brood is scarce, or use methods that penetrate brood cycles to reduce mite reproduction effectively.
Are there seasonal differences in how I should interpret mite numbers?
Yes. Spring buildup and late summer show higher reproductive activity, so lower thresholds may warrant action. Winter and early spring counts reflect overwintering pressure; treat proactively if counts rise before brood rearing increases. Always consider local climate and nectar flows.
How can I reduce reinfestation after treating a colony?
Isolate treated colonies when possible, maintain strong apiary hygiene, avoid leaving weak colonies as mite reservoirs, and monitor neighboring yards. Requeen with hygienic or varroa-tolerant stock and combine chemical treatments with integrated pest management practices like brood breaks.
Should I use chemical treatments every year?
Not necessarily. Rotate chemical treatments with non-chemical measures to slow resistance. Use treatments based on monitoring data and thresholds rather than calendar schedules. When you do use acaricides, follow label instructions and confirm efficacy with post-treatment checks.
How do viruses relate to mite monitoring?
Mites spread viruses such as deformed wing virus (DWV). High mite levels correlate with increased viral loads and colony decline. Monitoring mites helps predict virus risk and supports timely treatment to limit disease transmission and preserve colony health.
What records should be kept for effective mite management?
Keep dates, method used, sample size (number of bees for washes), raw counts, temperature, treatment details, and colony notes (brood, queen status, population). Consistent records let you spot trends, compare treatments, and refine thresholds for your apiary.