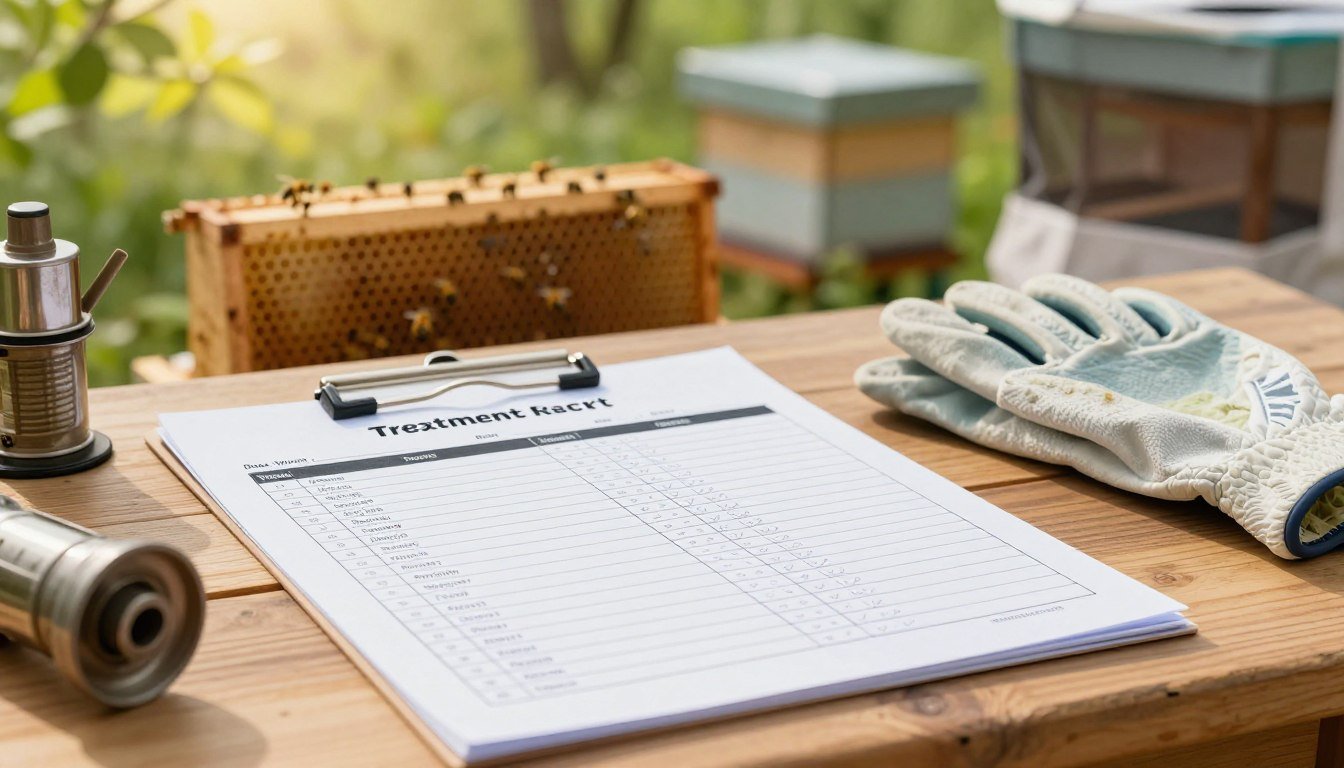
Keeping clear logs helps you track colony health through the active season. A simple, structured form makes it easy to note the date, hive number, and mite counts. This prevents gaps that often hide rising infestation risks.
VarroaVault offers a free log template as a PDF or Excel file to suit paper or digital workflows. Use a dedicated log for each colony so every event and condition is documented and easy to review.
Well-kept records let a beekeeper spot trends across apiary sites and seasons like spring. When entries include notes about time, conditions, and number of mites, it becomes simpler to manage multiple hives. For sample templates and guidance, consult the Code of Practice templates.
Key Takeaways
- Use a structured form to log every event with clear dates and hive numbers.
- Track mite counts and conditions to spot infestation trends early.
- Keep a separate log per colony to avoid losing vital history.
- Choose PDF or Excel templates to match your workflow and habits.
- Consistent notes across the apiary improve long-term colony management.
The Importance of Maintaining Accurate Hive Records
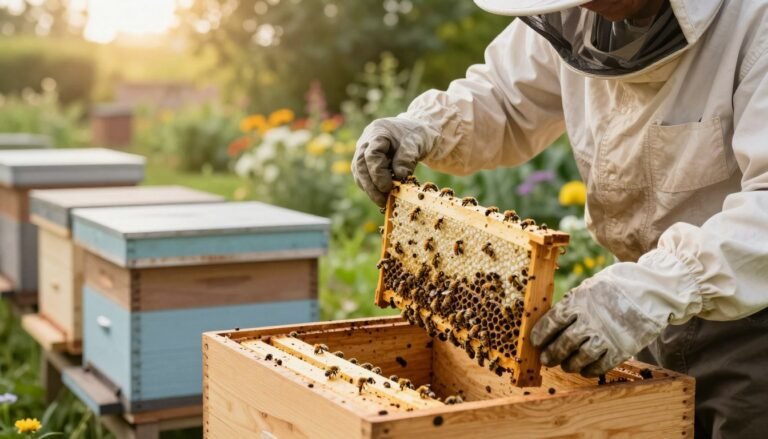
Keeping precise notes on each colony turns routine inspections into actionable information for management and research.
Accurate records are a legal and practical necessity. The Australian Honey Bee Industry Code of Practice requires legible documentation of all biosecurity activities. Those entries reassure state officials that your hives pose no biosecurity risk when moved across borders.
Routine forms, such as the Apiary Inspection Sheet, streamline daily management of hives and colonies. Section 3.1 mandates that every hive be checked at least twice a year for pests and disease.
Detailed logs support eradication and management programs if an exotic infestation appears in your area. Historical information helps trace spread, evaluate management strategies, and guide response efforts.
- Maintain consistent entries to track colony strength, inspections, and seasonal changes.
- Use standardized forms to simplify audits and interstate movements.
- Leverage data as a living record to refine honey production and apiary practices.
For practical templates and tips on inspection habits, see this guide on inspection and recordkeeping and advice on documenting your beekeeping journey.
Essential Components of a Varroa Treatment Record Sheet for Beekeepers
Capture the right fields at the inspection to make each entry useful.
Start with identification: list the apiary name, hive identifier, colony number, and the year. Add the product name, active ingredient, and EPA or registration number.

Treatment Product and Active Ingredient
Record the full product name and the active ingredient to track rotation and prevent resistance. Note the dose applied, such as strips used or mL of dribble, and the method of application.
Application and Removal Dates
Document the exact application and removal date and time. Missing a removal creates compliance gaps and may affect honey withholding intervals.
Colony Strength and Brood Status
Estimate population as frames of bees or simple ratings: strong, medium, weak. Mark brood status as broodless, minimal brood, or active brood to interpret efficacy.
- Include space for temperature and other conditions.
- Add a short notes field for results and follow-up actions.
For monitoring protocols and counts, see the managing mites guide and an alcohol wash guide.
Implementing Standardized Monitoring Protocols
Consistent monitoring schedules catch rising mite levels before colonies weaken. Set a baseline by sampling every 3–4 weeks during the active season. This gives timely data to guide management and protects honey and adult bee populations.
When counts approach threshold, test more often. The Honey Bee Health Coalition suggests a 2% threshold in spring and summer, and 1% in fall. Increase sampling to every 2 weeks when near those levels or right after treatments.
Frequency of Mite Counts
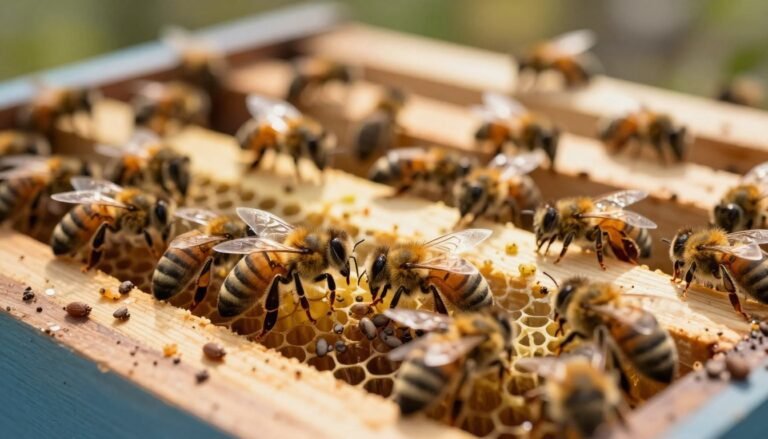
Use standardized methods: sugar shake, alcohol wash, or drone uncapping. Each method gives a consistent adult bee infestation estimate.
Track each sample on your log: include the date, number of bees sampled, resulting mite count, colony strength and frames. Add notes about conditions and time of day to improve interpretation.
“Monitoring before and after intervention creates the evidence needed to assess effectiveness and protect colonies.”
| Method | Sample Interval | When to Increase | Notes |
|---|---|---|---|
| Alcohol wash | 3–4 weeks | Near threshold / post-treatment | Reliable adult bee count |
| Sugar shake | 3–4 weeks | Near threshold / post-treatment | Works when brood present |
| Screened bottom board | Measure over 3 weeks (spring) | Use to estimate natural mortality | Good for post-winter assessment |
Keep clear notes on infestation trends and colony strength. Consistent logs also support broader research and help you interpret post-intervention data — see post-treatment mite counts for guidance.
Meeting State Inspection and Regulatory Requirements
State inspectors require clear documentation that lists product name, EPA registration number, and the exact date and time of any application. Keep each entry legible and easy to review so officials can verify compliance quickly.
Paper logs are acceptable if they are complete and readable during a visit. Many beekeepers pair paper notes with a digital backup that can export summaries if a formal inspection requests data for the year.
Maintain movement logs for every hive and any introduced equipment. These entries satisfy biosecurity rules and help trace risks if an infestation appears in your area.

If you suspect an exotic pest, call the Emergency Plant Pest Hotline at 1800 084 881 immediately. Prompt reporting helps protect honey production and other colonies across the region.
- Keep one place for each section of your documentation so inspections are fast and complete.
- Use consistent notes to demonstrate good management and support ongoing research.
- Structured systems make it easier to prepare summaries or exports; learn time-saving tips in this time management guide.
Analyzing Treatment Efficacy and Colony Health
Measuring outcomes after an intervention turns raw counts into actionable decisions for your apiary.
Calculating Mite Reduction Percentages
Use this formula: ((pre-count – post-count) / pre-count) x 100. Results above 90% indicate an effective approach.
Run a post-count 2–4 weeks after the application ends. Compare the pre- and post-sample entries on your sheet to calculate the percentage.
Identifying Potential Resistance
If efficacy falls below 80%, investigate resistance, application error, or fast re-infestation. Note colony strength, frames of bees, and bottom board findings when you record results.
Method notes: use an alcohol wash or soapy water wash to assess adult bee infestation. Stir soapy samples every 5 minutes for 30 minutes to dislodge mites. With the powdered sugar method, ensure bees and equipment are fully dry.
- Document date, inspection notes, and colony strength alongside counts.
- Track bottom board natural fall as a supplementary data point.
- Compare seasonal results to refine management strategies.
“Consistent analysis of colony health enables data-driven care across the season.”
For a detailed efficacy summary, see the efficacy summary.
Transitioning from Paper Logs to Digital Management
A digital dashboard transforms scattered entries into clear timelines for each colony’s PHI.
Automating pre-harvest interval calculations saves time and reduces risk. Systems can show that Apivar (amitraz) has a 56-day PHI while MAQS and oxalic acid list a 0-day PHI. This keeps the exact clearance date visible on each hive tile.
Import historical notes to build a continuous history of treatments and colony health. Cloud storage prevents loss from fire, water, or misplacement and keeps records searchable across seasons.

- Automated PHI alerts send phone notifications so you never miss a harvest date or post-treatment count.
- Dashboards track each colony and let you review past treatments and honey-clearance timelines at any time.
- Historical import features let you migrate paper logs into a single digital archive.
To see common gaps and ways to import legacy notes, review this guide on treatment record gaps and practical field notes strategies.
Conclusion
Consistent entries turn inspection notes into a clear plan that strengthens colony health.
Document each date, sample, and action so you can track mite levels, brood patterns, and adult bee counts over seasons. Good notes make management choices easier and protect hive value.
Use either paper logs or a digital tool that suits your apiary. Learn about practical monitoring methods to standardize counts and compare results. Accurate records also help identify resistance and meet state inspection needs.
Start a simple, consistent system today. Small habits yield big gains in colony survival and overall bee health.
FAQ
What information should be recorded about the product and active ingredient?
Record the commercial product name, active ingredient (e.g., amitraz, thymol, oxalic acid), concentration, batch or lot number, and manufacturer. Include application method (strip, drip, vapor, spray), dosage per hive, and any label restrictions. This helps track efficacy and ensures compliance with label directions and state regulations.
How often should I perform mite counts and which methods work best?
Monitor mite levels at least monthly during active season and more frequently during population peaks like late summer. Use standardized techniques such as alcohol wash, sugar shake, or sticky boards. Choose one method and stick to it for consistent trend data; note method, sample size (number of bees or frames), and person conducting the test.
When should application and removal dates be logged?
Log the date and time of every application and removal or completion of a treatment cycle. Include start and end dates for slow-release options, and note any reapplications. Accurate timelines support pre-harvest interval calculations and help assess correlations between treatment timing and mite reductions.
What colony strength and brood status details are most useful?
Record adult bee population estimates (frames covered), sealed brood area, presence of drone brood, queen status, and any recent splits or requeening. Note signs of disease, brood pattern quality, and honey stores. These metrics contextualize mite counts and guide management choices.
How do I calculate mite reduction percentages after an intervention?
Use pre- and post-intervention counts with the formula: ((pre-count − post-count) / pre-count) × 100. Ensure sampling methods and population sizes match. Document sample dates, method, and environmental conditions to validate comparisons.
What indicates possible resistance to a control product?
Suspect resistance when consistent treatments of the same active ingredient yield poor mite reduction (
What records are required for state inspections and regulatory compliance?
Maintain clear logs of product names, active ingredients, application dates, dosages, applicator name, lot numbers, and any withdrawal or pre-harvest intervals. Include inspection notes, movement between apiaries, and biosecurity actions. Keep records for the period mandated by your state agriculture department.
How can digital tools improve hive management and record keeping?
Digital platforms and apps automate timestamping, map hive locations, and standardize monitoring entries. They can calculate mite reduction, flag high-risk colonies, and store photos and lab results. Choose software that exports reports for inspections and integrates with spreadsheets.
How do I manage pre-harvest intervals and honey safety?
Track product label pre-harvest intervals and mark treated colonies in your records. Use automated calculators or calendar reminders to prevent harvesting or moving supers until safe. Note any off-label or emergency uses and consult state guidance to avoid contaminated honey.
What notes should be added during inspections beyond numerical counts?
Document weather, forage conditions, nearby pesticide exposure, queen quality observations, varroa management strategies used, brood diseases, and behavioral changes. Include the inspector’s name, time spent, and follow-up actions. These qualitative notes support trend analysis and decision-making.
How many hives should be sampled per apiary to get reliable data?
Sample a representative subset: at least 5–10% of colonies in large apiaries, a minimum of 3–5 hives in smaller yards. Focus on weak or suspect colonies and randomly select others for baseline data. Consistent sampling locations and methods yield better long-term trends.
Can I use sugar shakes instead of alcohol washes and what are the trade-offs?
Sugar shakes are non-lethal and good for monitoring, but they can undercount compared with alcohol washes. Use sugar shakes when you need to preserve bees; use alcohol washes for greater accuracy. Record the method used and be consistent when comparing results.
How should I document colony interventions like splits or requeening?
Note the date, reason, source queen or queen cell, any marking, and resulting changes in population or brood. Link these events to subsequent mite counts and treatments to evaluate how management actions influence pest dynamics.
What key metrics help analyze colony health alongside mite levels?
Track adult bee population, sealed brood area, honey and pollen stores, queen condition, disease signs, and mortality rates. Combine these with mite data to assess overall colony resilience and to prioritize interventions.
How do I prevent repetitive chemical use and reduce resistance risk?
Rotate active ingredients with different modes of action, integrate non-chemical controls (drone brood removal, oxalic acid vaporization, screened bottom boards), and base applications on threshold-based monitoring. Record rotation schedules and efficacy outcomes in your management log.