This article lays out a clear framework to improve logistics and hive health across large agricultural agreements. Commercial beekeepers faced rising demand and complex schedules in the past, and this piece shows practical ways to meet those pressures.
The guide highlights methods to streamline hive movement, reduce travel time, and protect colony welfare. It balances grower needs and beekeeper capacity with actionable steps.
Readers will find strategies that draw on current industry standards and real-world tactics. The focus is on efficiency, safety, and predictable outcomes when arranging large-scale pollination services.
Key Takeaways
- Understand a tested framework to optimize logistics and hive placement.
- Use data-driven scheduling to boost efficiency and colony health.
- Balance grower demands with beekeeper capacity to reduce stress on hives.
- Apply industry best practices to improve success in managed pollination.
- Adopt simple steps that cut costs and increase reliability across sites.
Understanding the Importance of Pollination Route Planning for Multi-Farm Contracts
Effective logistics are often the difference between healthy colonies and costly losses during peak bloom. This article provides concise information to help operators who manage thousands of hives across wide U.S. geography.
Good sequencing reduces travel time and keeps colonies in better condition when they arrive at each site. When bees face less stress, they perform more reliably and support stronger crop yields.
Proper scheduling also protects your business. By prioritizing efficient moves, managers lower fuel and labor costs while improving livestock welfare.
Key benefits include:
- Reduced transit stress and fewer colony losses.
- Improved timing to match bloom windows and maximize hive impact.
- Enhanced predictability that farmers value under long-term agreements.
Strategic movement and clear documentation form the backbone of a sustainable commercial model. This article lays out the steps to make that model practical and repeatable.
The Current State of Commercial Pollination Services
A brief window in late winter dictates the flow of millions of colonies and the pace of operations. The U.S. industry concentrates immense effort into a short season that shapes annual revenue and hive health.
Trends in bee populations
Data show 1.3 million acres of almond require roughly 2.6 million honey bee hives each year. Colony shipments into California rose 64% between 2008 and 2018, with 1.8 million colonies arriving in 2018.
Researchers note that 90% of commercial colonies cluster in the state during the bloom. This event uses about 82% of the nation’s honey bee population and drives close to one-third of beekeeping income.
The California almond market
Managing these concentrations raises clear issues: transportation costs, winter mortality, pesticide exposure, and the need to maintain hive quality. Beekeepers must weigh these risks against the seasonal value of orchards.

Below is a compact summary of key figures and geographic supply sources.
| Metric | Value | Primary Suppliers | Seasonal Impact |
|---|---|---|---|
| Almond acres | 1.3 million acres | California orchards | Major national demand spike |
| Hives needed | 2.6 million hives | ND, ID, FL, OR, TX | Concentrated one-month use |
| Shipments (2018) | 1.8 million colonies | Multiple states | 64% increase since 2008 |
| Economic share | ~33% of beekeeper income | Structured market | High revenue vs. high risk |
“Almond pollination is the most structured market for services and strongly influences commercial beekeeping operations.”
Operators can learn more about operational risk and movement impacts in the migratory risk analysis.
Developing a Comprehensive Pollinator Management Plan
A practical plan maps resources, sets priorities, and guides habitat improvements season to season.
A pollinator management plan (PMP) is a written document that outlines site-specific strategies to support pollination and pollinators. It captures the farm’s land, water, and existing habitat and turns local knowledge into action.
Start by listing on-site resources and gaps. Set clear, time-bound goals so limited funds go to high-impact steps that help both the crop and local bees.
Make the plan flexible. Adjust goals as cropping schedules, budgets, and overall management change. A living document helps you respond to seasonal shifts.
- Identify immediate habitat fixes and long-term restoration targets.
- Prioritize water access, bloom continuity, and nesting areas.
- Assign roles and timelines to ensure follow-through.
| Plan Element | Action | Timeline | Outcome |
|---|---|---|---|
| Resource inventory | Map land, water, habitat | 1–2 months | Baseline resource list |
| Goal setting | Define short and long goals | Seasonal | Targeted investments |
| Implementation | Habitat creation & monitoring | Ongoing | Improved pollinator health |
“A concise PMP helps growers direct resources to priority actions that benefit crop production and pollinator health.”
For technical guidance and templates, consult the USDA resource on habitat practices: NRCS pollinator habitat guidance.
Inventorying Your Farm Resources and Habitat
Start by tracing a simple map of your property to reveal pockets of habitat that support bees and other pollinators.
Mapping Existing Habitat
Use an aerial photo or a hand-drawn sketch to mark hedgerows, forest areas, crop edges, ponds, and buildings.
Phillip Stowe of Walking Plants Orchard used an aerial map to locate his packing shed, house, and spots ideal for native habitat. This practical step revealed priority areas to add flowers and nesting sites.

- Record soil types, water access, and microclimates to understand land diversity across seasons.
- List non-physical assets: available time, local expertise, and potential grant funding.
- Map where cover crops or buffer strips would protect your crop and raise flower abundance.
| Item | Action | Short-term Benefit |
|---|---|---|
| Aerial map | Identify habitat pockets | Targeted planting sites |
| Water sources | Maintain pond or trough | Consistent pollinator access |
| Human resources | Document time and expertise | Better long-term management |
Result: A clear inventory turns your farm into a thriving ecosystem and sets a strong baseline for long-term resource enhancement.
Setting SMART Goals for Pollinator Health
Set clear, time-bound targets to turn habitat ideas into measurable actions on your farm.
Start with SMART criteria: Specific, Measurable, Achievable, Relevant, and Time-bound. This focuses budget and labor on steps that yield real outcomes.
Examples make goals tangible. Aim to establish 2 acres of permanent prairie by year three to supply steady floral resources. Or adopt low-impact fungicides across 25% of crop acres within 12 months to reduce harm during bloom and improve pollination results.
Break targets into 1-year, 2–5 year, and 6–10 year blocks. Short wins build staff momentum. Mid-term work expands habitat. Long goals secure certification and market value.
| SMART Element | Example Target | Timeline |
|---|---|---|
| Specific | 2 acres prairie | 3 years |
| Measurable | 25% low-impact fungicide adoption | 12 months |
| Relevant | Reduce drift via FieldWatch communication | Ongoing |
| Time-bound | Achieve “Bee Friendly Farming” step | 5 years |
Review goals regularly. Measure visits by native pollinators, record bloom continuity, and adjust tactics to keep the plan effective and tied to crop outcomes.
Navigating the Logistics of Multi-Farm Contracts
Deciding between direct grower agreements and brokered services shapes costs, risk, and long-term stability. Choose the model that matches your operation size, cash flow needs, and tolerance for operational overhead.
Direct contracting often gives higher margins and closer grower relationships. It requires more admin time, scheduling work, and clear written terms. A 2015 survey found 53% of almond growers rented colonies directly, showing many prefer that hands-on approach.
Brokerage can reduce administrative burden. Brokers may guarantee quality and timely payment, which reduces financial risk for both beekeeper and grower. In the same 2015 study, 44% of growers used independent brokers.

Establishing Long-Term Relationships
Long partnerships pay off. About 80% of almond growers reported using the same beekeeper for at least four seasons. The author of the study notes 29% kept those ties for 11+ years.
Written agreements matter. Data show operations using written deals tend to be larger and report better yields than those relying on oral arrangements. Clear terms help cover transportation costs, pesticide risk, and hive stress during moves.
| Item | Benefit | Percent |
|---|---|---|
| Direct rental | Closer control | 53% |
| Broker use | Payment & quality guarantees | 44% |
| Long-term partners (4+ seasons) | Stability & repeat demand | 80% |
Communicate colony strength and expected results up front. That information lets beekeepers set prices that cover prep and transport, making pollination services economically sustainable.
To see options for renting colonies in the U.S., review this guide on renting bees for pollination services.
The Role of Pollination Brokers in Modern Agriculture
Brokers bridge growers and beekeepers, turning scattered hive inventories into reliable field coverage.
These intermediaries manage hundreds of transactions across wide land areas. They guarantee a colony quality standard so growers receive predictable services during bloom.
By contracting many suppliers, brokers can swap out weaker hives quickly. That flexibility reduces risk when a beekeeper reports high mortality and preserves crop yields.
- Value: brokerage fees vary widely, typically $2–$20 per colony depending on service complexity.
- Logistics: brokers coordinate the map of hive placement and timing to match bloom calendars.
- Cash flow: timely payments help beekeepers stabilize honey and pollination operations.
The Almond Board lists over 40 brokers, showing how common this model has become. Industry surveys also find brokers often handle the tedious admin tasks that would otherwise fall to growers or beekeepers.
“Centralized services make it easier for large operations to secure the hives they need while reducing operational risk.”
Evaluating Contractual Clauses for Mutual Benefit
Well-drafted clauses turn vague expectations into measurable protections that benefit both beekeeper and grower. Clear terms can reduce uncertainty, improve colony survival, and protect seasonal income.

Valuing Contract Enhancements
Include explicit pesticide limits and timing. Clauses that ban tank-mixing fungicides or require night applications cut exposure and lower on-site risk.
Research by Brittney Goodrich shows many beekeepers accept an $8 discount per colony when pesticide protections are in place. That savings equals about 4% of a typical $200 fee and adds up across large operations.
- Prepayments: A 40% advance helps cover transport and setup costs and is highly prized by suppliers.
- Colony standards: Specified strength levels and inspection rights improve overall quality and results.
These enhancements often attract higher-quality partners even if base pay is lower. The author notes that risk-averse operators especially value such clauses.
“Contract features that reduce chemical exposure and provide working capital lead to longer, more stable relationships.”
See linked guidance on how to measure service efficiency to tie these terms to measurable outcomes: measure pollination efficiency.
Managing Pesticide Exposure and Chemical Safety
Simple on‑farm steps can cut chemical risk and protect hive performance during sensitive periods.
Fungicides and other sprays can become dangerously synergistic to honey bee health when combined. Apply chemicals at night when bees are not foraging to reduce acute exposure.

Use buffers and habitat strips near crop edges to limit drift from neighboring land. Register hive locations on platforms like FieldWatch to improve spray coordination and transparency.
- Map application areas: mark spray zones so trucks and staff avoid active hives.
- Adopt IPM: reduce overall pesticide use and prioritize less toxic options.
- Communicate: share spray schedules with beekeepers to lower unexpected losses.
The average commercial operation surveyed ran about 5,700 colonies. Small concessions that reduce chemical exposure can yield large value in avoided losses and better results during bloom.
“Prioritizing chemical safety protects pollinators and strengthens the reliability of pollination services.”
Integrating Flowering Cover Crops into Your Strategy
Well-chosen cover mixes support bees across seasons and improve both soil and pollinator outcomes. Planting blooms near trees and rows gives visiting colonies steady nectar and pollen while enriching the land.

Selecting Bee-Friendly Forage
Select diverse mixes: brassicas, legumes, and grasses. Research values a brassica mix at about $6 per colony. Soil-builder mixes with legumes add long-term resource gains.
Clovers are useful but note bloom timing. If they flower after honey bee presence ends, their value to the crop season drops.
Water Management for Cover Crops
Many orchards use micro-sprinklers that may not wet seedbeds enough. Test germination in small plots before wide planting.
Map areas where cover crops won’t compete with fruit trees or irrigation. Proper placement cuts costs and reduces risk that covers become weeds.
- Staggered bloom maintains resources across seasons.
- Field mapping limits interference with production and irrigation.
- Cost offset comes from better bee health and improved pollination results.
Financial Considerations and Budgeting for Pollination
Counting true costs reveals whether an annual pollination program adds or subtracts from farm profit.
Start by calculating net annual investment: total costs minus grants, cost-share payments, and any market premiums. Include fixed costs such as equipment rental and insurance, and variable costs like labor, seed, and transport.

Note: shipping may represent about 25% of the fee when colonies travel long distances, such as east-to-California moves during almond bloom.
- Factor potential honey loss into revenue expectations.
- Account for colony loss risk when setting prices and contingency funds.
- Use cost-share programs through USDA NRCS to offset habitat installation expenses; see Supporting Pollinators in Agricultural Landscapes for guidance.
| Expense | Example Annual Cost | Impact on Fee |
|---|---|---|
| Transport & fuel | $20–$50 per colony | High |
| Labor & setup | $10–$30 per colony | Medium |
| Seeds & habitat | $5–$15 per acre | Long-term value |
| Forgone honey | $5–$40 per colony | Depends on crop timing |
Tip: high-strength colonies command higher fees. Budgeting that detail helps you judge if current arrangements deliver the expected production and value over the season.
Assessing Colony Strength and Quality Control
Objective colony checks are critical to deliver consistent results during bloom. A short, repeatable inspection program reduces guesswork and protects both growers and beekeepers.

Standardizing Colony Strength Inspections
Define an active frame: bees must cover at least 75% of both sides of the comb or average four bees per square inch. Use that metric across all sites to compare strength reliably.
Many growers hire third-party inspections. Typical fees run $1.50–$2.00 per hive for sampling 10–25% of colonies. That independent data supports payment adjustments and selection of partners.
- Premiums: high-strength colonies often earn a 5.7%–8.6% premium, reflecting greater crop value.
- Weather: bees rarely forage below 55°F, so strong hives matter during cold events.
- Health link: colony strength inversely tracks winter mortality, making it a key health indicator.
Standard inspections across areas improve control and transparency. Use the inspection records to rank suppliers, refine management diversity, and protect your investment in pollination services.
Learn more about operational checks and labor roles at managing apiary labor efficiency.
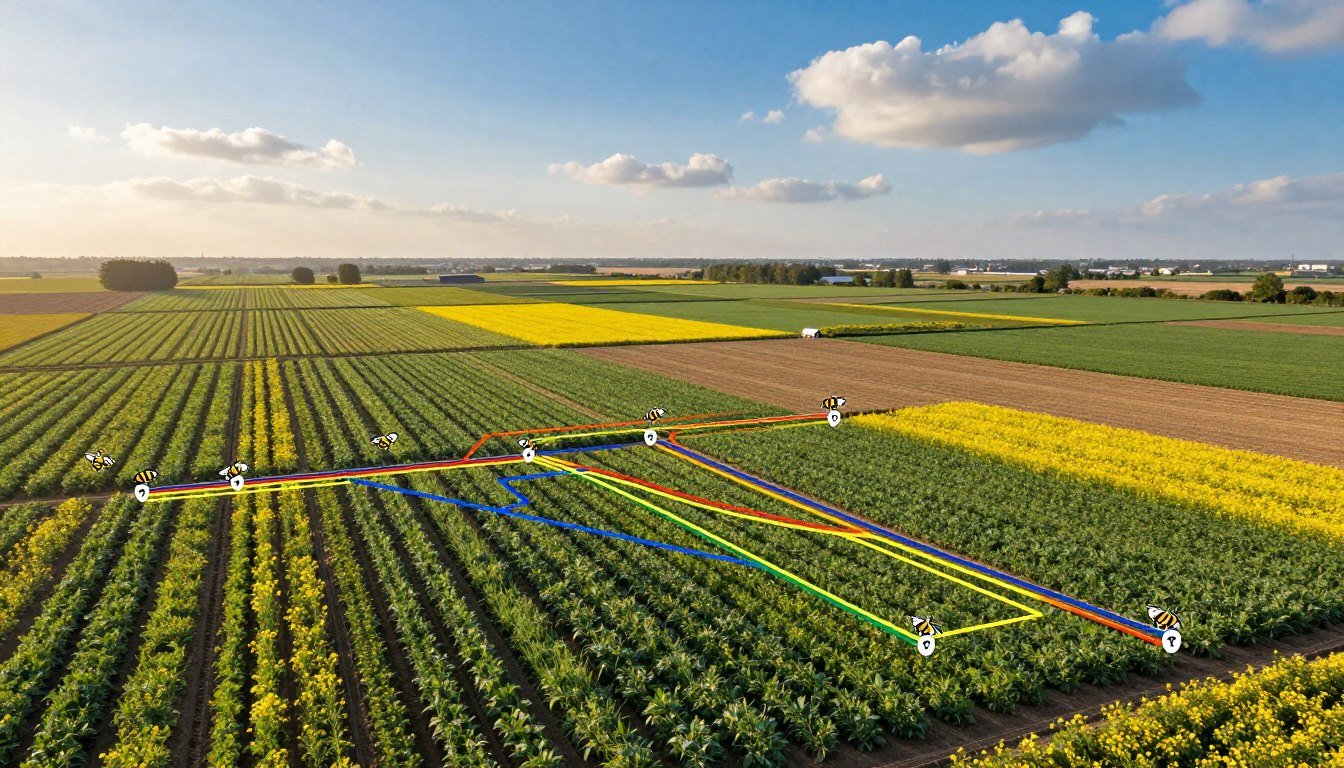
Leveraging Technology for Route Optimization
Cloud-based trackers and mapping software reduce transit delays and improve on-site timing during peak bloom.

Digital tools let managers visualize a full map of hives and bloom windows. This visibility saves time and fuel while lowering stress on colonies.
Use GPS tags and simple dashboards to track hive locations and expected bloom dates. Plug live weather and traffic information into the schedule so teams can adapt quickly.
Benefits include healthier colonies, fewer emergency moves, and clearer documentation of movements that supports traceability and quality claims.
| Tool | Benefit | Typical Use | Impact |
|---|---|---|---|
| GPS hive trackers | Live locations | Daily checks | Reduced transit time |
| Mapping software | Visual routes | Season sequencing | Fewer delays |
| Weather API | Real-time alerts | Day adjustments | Protected colony health |
| Logbook apps | Movement records | Compliance & invoices | Improved traceability |
Adopting these resources helps coordinate growers, brokers, and beekeepers. The article highlights that operators who integrate live data see better results and higher operational value. For research on effects of real-time tracking, consult a recent study.
Learning from Successful Case Studies
Concrete case studies show how habitat choices and timing combine to boost production and biodiversity on working farms.

Phillip Stowe of Walking Plants Orchard manages 1.5 acres of haskap berries and 2 acres of fruit trees. His 2024 plan added 682 haskap bushes and Dutch white clover to supply nectar across seasons.
Stowe invested about $12,866 in the first two years for installation and upkeep. The result: roughly 3,000 pounds of fruit annually and improved honey bee forage that supports hive health.
Evan and Jessica Molin of Molin Meadows Farm steward 25 acres with 5.5 acres of new pollinator plantings. Their mix includes a 1-acre green firebreak, 2.8 acres of perennials, 1.7 acres of natives, and a 100-foot hedgerow.
The Molins plant two rows of zinnias for every eight rows of produce. This practice drew a wider diversity of bees, moths, and butterflies and cut chemical sprays through better natural pest control.
- Key lessons: dedicate resources early, match species to seasons, and track results over time.
- Value: higher on-farm diversity leads to disease resistance and fewer sprays.
- Takeaway: these examples offer practical information and inspiration to adapt management on similar land.
| Farm | New Acreage | Two-Year Cost |
|---|---|---|
| Walking Plants Orchard | ~3.5 acres | $12,866 |
| Molin Meadows Farm | 5.5 acres | $13,900 |
Adapting to Seasonal and Environmental Challenges
Successful operations anticipate drought, cold snaps, and uneven flower displays and then act quickly.
Short-term adjustments can protect colony health when forage is scarce or temperatures keep bees grounded. Winter decisions—pest treatments, emergency feeding, and hive insulation—help reduce losses and keep honey bee populations stable.
Extreme weather and drought cut nectar and pollen across large areas. That forces many colonies to rely on stored honey and makes monitoring critical.
Growers and beekeepers must coordinate on bloom timing, shared water access, and reduced pesticide use so colonies survive the season and deliver reliable results.
“Healthy native and managed pollinators are the best defense against unpredictable conditions.”
| Risk | Immediate Response | Seasonal Benefit |
|---|---|---|
| Drought | Provide water & supplemental feed | Prevents starvation |
| Cold snaps | Insulate hives & reduce openings | Maintains winter strength |
| Pesticide drift | Coordinate spray schedules | Reduces colony stress |
Planting diverse flowers across time supports bees and native pollinators. Proactive management and lower pesticide loads cut long-term costs and boost the value of your land and crop outcomes.

Conclusion
When managers align goals, tech, and habitat, both crops and hives gain measurable benefits.
This article outlines practical steps to optimize pollination and the delivery of services across wide areas. Use clear agreements, consistent quality checks, and habitat investment to raise the long-term value of pollination services.
Growers and beekeepers who prioritize data, transparent terms, and bee health reduce losses and save time. Healthy pollinators support better yields and more stable honey returns.
Adopt these approaches to build durable partnerships. Shared goals and timely communication make the system resilient and profitable for the entire agricultural community.