Setting fair rates for pollination work rests on clear data and sound judgment. A 2006 FAO report frames the economic value of pollination and guides modern valuation methods.
Understanding operational costs, biological risks, and market value is essential. Break down expenses for hive care, transport, and labor. Add buffers for seasonal losses and disease risks.
This guide uses FAO data and practical metrics to help you build a competitive model. It shows how the number of management variables affects fees and long-term sustainability.
Our aim is to give clear information that helps you negotiate contracts that reflect your expertise and cover overhead. Use this section as a concise roadmap for fair, profitable agreements.
Key Takeaways
- FAO 2006 offers a framework for valuing pollination in agriculture.
- Account for operational costs, biological risk, and market value.
- Track the number of hive variables to refine your rates.
- Use reliable data when drafting contracts and invoices.
- Balance competitiveness with long-term sustainability.
Understanding the Economic Value of Pollination
Estimating the economic worth of insect pollination means linking field yields with market returns. That link separates direct gains from indirect benefits that keep farms resilient.
Direct Use Value
Direct use value comes from increased fruit and seed production. Studies by Southwick & Southwick (1992) and Morse & Calderone (2000) place annual U.S. figures between US$6 and 14 billion.
Indirect Use Value
Indirect value includes ecosystem regulation, biodiversity support, and long-term production stability.
“The 2006 FAO study highlights pollination’s role across a wide range of crops, including many tree species dependent on insects.”
Understanding demand at the state level helps beekeepers move beyond honey metrics. A notable case from Ethiopian coffee production shows how measurable gains guide valuation and adapt when market conditions change.
| Value Type | Main Benefit | Example Metric |
|---|---|---|
| Direct | Higher fruit yield | Yield increase per hectare |
| Indirect | Ecosystem health | Pollinator diversity index |
| Market | Demand-driven premiums | Price per quality grade |
| Risk Buffer | Loss protection | Insurance-adjusted cost |
For deeper methodology and supporting data, consult the FAO chapter on pollination economics and a practical guide on how to measure pollination efficiency.
How to Price Crop Pollination Services Effectively
Set rates that cover full colony upkeep and leave room for a fair return. Start by listing every operating cost: feed, medicines, specialized equipment, transport, and labour. Include an annual buffer for losses and unexpected disease outbreaks.

Use industry data and recent survey results when benchmarking per-hive price. Many beekeepers adjust fees based on the number of bees needed for apples or other high-demand crops.
Compare income potential against total costs to ensure the model sustains production without eroding margins. Review regional trends to find the acceptable range of prices and change contract terms by season or demand.
- Account for labour and specialised gear in every estimate.
- Match colony strength to the farmer’s production needs.
- Keep terms flexible for seasonal shifts and market value changes.
Assessing the Impact of Crop Types on Pricing
The biology of each crop alters the real cost of providing pollination. Some plants supply rich pollen and nectar while others offer poor nutrition that stresses colonies. That difference affects labor, management, and long-term value for beekeepers.
Crop Sensitivity and Pollen Quality
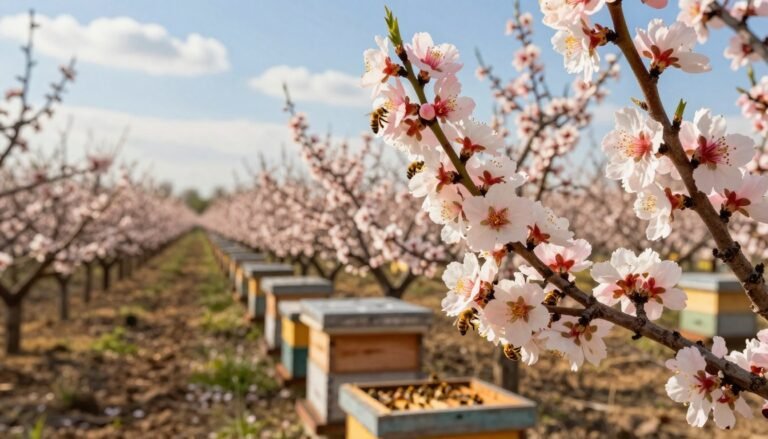
Certain crops, such as almonds and apple trees, are especially sensitive to pollen quality. Those orchards often demand higher price per hive because colonies need extra feed or care before and after exposure.
Data shows service intensity and foraging strain vary between fruit types. When a plant offers little nutritional value, colony health declines faster and production losses rise.
- Match management to plant needs; factor extra feed and inspections into any fee.
- Consider long-term value — higher short-term payment can offset colony decline and lower replacement costs.
- Use data from past seasons to set a fair range for specific trees and orchards.
In short, adjust terms by plant type and expected strain. That approach protects pollinators and secures fair compensation for the beekeeper.
Factoring in Seasonal Labor and Management Costs
Early-season investments in feed and inspections protect colony strength and future returns. Beekeepers spend significant labour preparing hives before bloom. That time drives much of the seasonal cost.

Feed costs for sugar syrup and pollen patties are predictable line items. Add routine checks, mite treatments, and winter recovery work. Each task takes time and reduces available production hours.
Track hours by contract so labour does not exceed expected income. Use simple logs that record hours per site, travel time, and materials used.
- Estimate labour per hive for setup, monitoring, and removal.
- Include a seasonal buffer for losses and extra inspections.
- Use past data to refine management budgets and set realistic terms.
Proactive off-season care lowers emergency costs during peak demand and maintains the long-term value of pollination service. For beekeepers exploring supplemental income, see beekeeping as a side income for practical cases and planning ideas.
Evaluating the Risk of Chemical Exposure
Chemical drift and on-site sprays can instantly reduce hive strength and make recovery costly.
Beekeepers often charge a premium when fields carry higher risk. Protecting honey bees from toxic sprays preserves both immediate production and long-term value.
Include clear contract terms that assign responsibility for known spray windows and record any incident that harms a colony.
- Site evaluation uses field records and recent data on local pesticide use before placing hives.
- Documented spray violations should trigger compensation or replacement clauses in the agreement.
- Regular checks cut labour losses and signal early chemical damage so mitigation can start fast.
| Risk Factor | Impact | Mitigation | Contract Action |
|---|---|---|---|
| Spray drift | Colony mortality, lost production | Buffer zones, timing limits | Liability clause, compensation |
| Systemic residues | Subtle decline, reduced foraging | Site selection, residue testing | Pre-placement testing |
| Accidental application | Total loss possible | Rapid removal, emergency care | Replace or reimburse colony value |
Calculating Honey Production Loss
Quantifying post-bloom honey shortfalls helps beekeepers set clear contract terms. Bees often consume stores while working a field, and that use lowers surplus available after the run.
Estimate the average feed taken per hive and the expected reduction in production. Record colony counts before and after placement to get real numbers.
Factor lost honey revenue into any pollination service fee so overall costs reflect real value. Studies link colony strength directly with future honey output and replacement needs.

| Metric | Typical Range | Contract Action |
|---|---|---|
| Honey consumed on-site | 5–15 lbs per hive | Deduct or reimburse |
| Post-service bee loss | 5–20% of workforce | Adjust fee or provide replacement |
| Surplus reduction | 10–30% yield impact | Compensation clause |
Include clear terms with growers about expected loss and inspection records. For broader economic context consult an economic analysis of pollination value and note regional risks described in a piece on climate impacts on beekeepers.
Accounting for Transportation and Logistics
Moving hives between farms brings hidden expenses that change a contract’s real value. Transport affects the final price and alters net return for beekeepers and growers.
Delivery Time
Long drives increase fuel, labour, and vehicle wear. Each loading and unloading event adds minutes that sum across the season.
Plan trips so you reduce repeat runs. Count the number of trips needed for delivery and removal when you build terms into an agreement.
Site Placement Logistics
Placement in clustered dumps cuts handling time compared with many small lots around an orchard. But tight clustering can stress bees if forage is limited.
Establish clear site terms with growers for timing, access, and setup. Good terms protect colony health and keep production steady.
| Logistic Factor | Impact | Mitigation | Contract Action |
|---|---|---|---|
| Distance | Higher fuel and labour costs | Route optimization, grouped placements | Distance surcharge |
| Trips per season | Increased handling stress on bees | Combined loads, scheduled windows | Trip count clause |
| Site access | Slow setup, longer time on site | Pre-inspection, clear directions | Access requirement in terms |
Use field data and the linked case on regional practice for benchmarking: transport cost study and a practical guide on renting bees for pollination.
Analyzing Market Demand and Regional Variations
Regional demand swings change what beekeepers can charge and where hives move each season.
Local patterns in production and grower priorities shape the perceived value of a pollination service. Monitor state reports and industry surveys to track demand and seasonal peaks.

Survey data reveals a wide range in prices across counties and crop zones. Use that data when you set competitive rates, and adjust for local labour, transport, and risk exposure.
“Beekeepers who align placements with regional demand capture more value and reduce empty runs.”
Track three indicators:
- Local demand intensity and season length.
- Recent survey prices and the competitive range.
- Commodity premiums that raise production value.
| Indicator | What it shows | Action |
|---|---|---|
| Demand intensity | High vs low seasonal need | Adjust placement schedule |
| Survey range | Competitive price window | Set local baseline |
| Production premiums | Higher market value per acre | Negotiate higher compensation |
Determining Hive Stocking Rates for Optimal Yield
Choosing the right hive density per acre drives the difference between average and peak fruit yields.
Use industry survey data and local observations when you set numbers for each tree type. Recommended ranges vary by fruit and bloom intensity. Matching the number of colonies to floral resources preserves colony health and increases production value.

Avoid overstocking: too many hives raises labour and replacement costs while stressing pollinators. Understocking leaves yield potential untapped and lowers the service value growers receive.
- Plan stocking by bloom density and orchard size.
- Adjust numbers after site visits and past-season data.
- Factor colony strength when quoting terms to protect long-term value.
| Crop Type | Typical Hives per Acre | Management Note |
|---|---|---|
| Almond-like trees | 1.5–3.0 | Higher density, monitor nutrition |
| Apple/stone fruit | 0.5–1.5 | Match bloom peak with colony strength |
| Open-field flowers | 0.2–0.8 | Cluster hives; reduce handling trips |
For a practical benchmark, consult the beehive stocking rate guidance that summarizes recent survey ranges and case findings. Use those numbers as a starting point and adjust for local demand and observed results.
Incorporating Feeding and Maintenance Expenses
A clear budget for feeding and upkeep makes the difference between break-even and profit.
Feeding expenses—sugar syrup, pollen patties, and supplements—are routine items that protect colony strength during a pollination service. Include these costs when you set any base fee so that honey loss does not erase income.
Consistent nutrition management also lowers replacement needs. Industry survey data links higher-quality feed with better survival and a higher price for the service in many regions.
Track per-hive feed use, labour for inspections, and treatment costs. Use site-level data after each placement to measure production loss and adjust terms for future runs.
- List feed and labour per visit in contracts.
- Add a small maintenance surcharge where risk is higher.
- Record inspections to justify adjustments after any loss.

| Expense | Typical Range | Contract Action |
|---|---|---|
| Sugar syrup & patties | $3–8 per hive per placement | Include line-item or reimbursement |
| Labour for checks | 0.5–1.5 hours per hive per season | Hourly or flat fee |
| Treatments & supplements | $2–6 per hive annually | Annual maintenance clause |
Establishing Base Rates for Short Term Contracts
Start short-term agreements with a clear baseline so both the grower and beekeeper know expected commitments and payments. Most pollinators use a $50 per hive base as a practical starting point for brief seasonal runs.
This base figure covers basic handling, placement, and standard feed needs. Adjust it when apples or other demanding crops require extra colonies, extra inspections, or added nutrition.

Communicate the base rate in writing and list any add-ons, such as transport surcharges, compensation for chemical exposure, or fees for replacement colonies after loss. Clear terms protect income and reduce disputes.
- Use $50 per hive as the baseline, then add adjustments for distance, risk, or added labour.
- Specify the number of colonies required for apples and similar crops in the contract.
- Share relevant local data and recent survey figures with the grower when negotiating.
For reference on floral resources and placement planning, see the best trees for bees guidance when estimating production value on a site.
Adjusting Prices for Long Term Pollination Agreements
Multi-year contracts reshape income forecasts and raise the stakes for colony health management.
Long-term agreements often require higher charges because colonies face repeated seasonal stress and added oversight. Beekeepers should reflect that added value when they set terms for extended runs.
Contracts covering multiple crops or seasons can provide steady income, but they also increase the number of managed colonies and raise operational costs. Data from almond cases shows stable demand but greater management effort and higher replacement risk.

Include clear clauses for expected honey loss, inspection schedules, and compensation for colony decline. That transparency protects beekeepers and growers and clarifies liability when losses occur.
| Term | Price Adjustment | Colony Impact | Contract Item |
|---|---|---|---|
| Short-term (single season) | Base fee or small surcharge | Low cumulative stress | Standard placement, brief checks |
| Multi-season (1+ years) | Higher fee, indexed increases | Higher management and loss risk | Honey loss clause, scheduled audits |
| Almond-focused long run | Premium for high demand | More colonies, repeated bloom stress | Colony replacement and nutrition plan |
Reviewing Industry Survey Data for Competitive Benchmarking
Benchmarking past market figures gives clear context for present negotiations. Use survey reports to compare historical values and set realistic terms.

In 2011, almond pollination reached more than US$150 per hive in California. That same year, Australian almonds showed about $73 per hive while apple runs were near $65.
These figures let beekeepers check their current rate against known ranges. Reliable research and industry data show how prices have changed over the years.
| Year / Region | Crop | Reported Range (per hive) |
|---|---|---|
| 2011 – California | Almonds | US$150+ |
| 2011 – Australia | Almonds | $73+ |
| 2011 – Mixed regions | Apples | $65+ |
Use benchmarking to protect income and manage colony risk. Compare local offers against industry surveys, and consult the FAO valuation chapter for broader context.
Managing Client Expectations and Service Terms
Defining obligations up front protects colony health and the business value of each placement.
Provide clear information on the number of colonies required and the expected outcomes for the grower. State anticipated honey loss and the possible effect on production in plain language.
Include explicit clauses for chemical exposure risk, compensation, and emergency response steps. Use documented data from past runs or an industry survey when you cite likely outcomes.
Data-driven communication builds trust. Share simple reports after inspections and show any change in colony strength or yields. That transparency helps final agreement terms feel fair.

“Clear, measurable terms prevent disputes and make the service a reliable investment for both parties.”
| Item | Grower Expectation | Beekeeper Action |
|---|---|---|
| Colony count | Agreed number per acre | Pre-placement inspection, report |
| Honey loss | Estimated lbs per hive | Compensation or credit clause |
| Chemical risk | Spray windows noted | Liability and mitigation plan |
Set professional terms that protect income and bee welfare. Clear agreements keep pollinators healthy and sustain the long-term value of the service.
Balancing Profitability with Sustainable Beekeeping
Maintaining steady income while protecting hive health requires intentional choices at every placement. Beekeepers must weigh short-term gains against the colony’s long-term resilience.
Sustainable management lowers unexpected loss and supports consistent honey production. Data shows that modest reductions in intensity lead to fewer replacements and steadier production over seasons.

Plan visits, rest cycles, and nutrition so colonies recover between runs. This preserves pollinators and keeps the service reliable for growers.
“Prioritizing colony health keeps operations viable and raises the value of each placement.”
| Metric | Benefit | Action |
|---|---|---|
| Colony turnover | Lower replacement costs | Limit consecutive placements |
| Honey yield consistency | Predictable revenue | Record pre/post counts |
| Risk exposure | Fewer losses | Site checks and agreements |
For a practical pathway that preserves bees and income, review a sustainable apiary plan. Clear planning keeps production stable and supports fair market prices.
Conclusion
A fair agreement starts with transparent cost accounting and a plan for managing colony risk over many seasons.
List actual operational costs, include buffers for loss, and track metrics that affect long-term production. Use clear records so negotiation rests on solid data and recent research.
Protect pollinators by matching intensity to the needs of crops and resting hives between runs. That approach keeps the honey bee workforce healthier and lowers replacement expense across years.
Address chemical exposure and documented loss in every contract. State expectations, inspection routines, and compensation terms so both growers and beekeepers share responsibility.
Balance business goals with pollinator welfare and you sustain a reliable pollination service that remains profitable and resilient across seasons in any state.