Varroa destructor has been a known threat since its description in 1904 on Java, Indonesia. Early detection matters: a 1% infestation level in April can cause a colony to collapse by September if left unchecked.
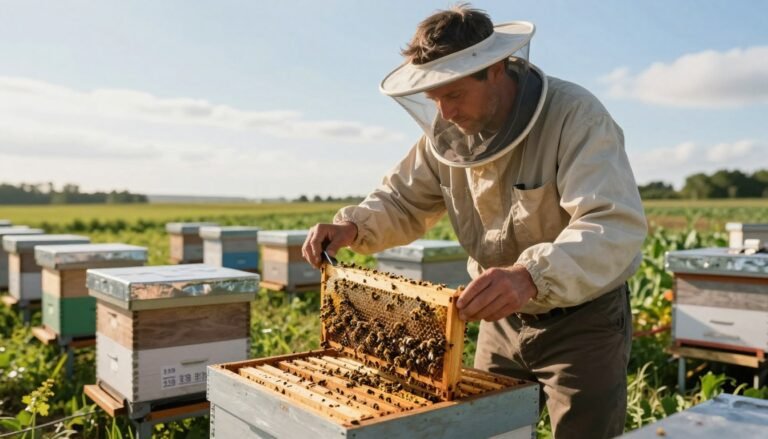
Professional beekeepers use a steady monitoring routine to track mites and protect bee health. Regular checks let you find a single mite before populations explode across the apiary.
Systematic sampling and clear thresholds guide action at each seasonal phase. This introduction points toward practical steps, from choosing the right sampling method to interpreting percentage results.
For detailed protocols and sampling targets, consult the standard guide on how to sample multiple hives for and follow integrated pest management practices to keep colonies productive.
Key Takeaways
- Varroa was first identified in 1904 and remains a major bee health threat.
- Even 1% in spring can lead to fall collapse; early monitoring is critical.
- Use consistent sampling schedules to detect mites before they spread.
- Follow thresholds by season and validate treatments with re-checks.
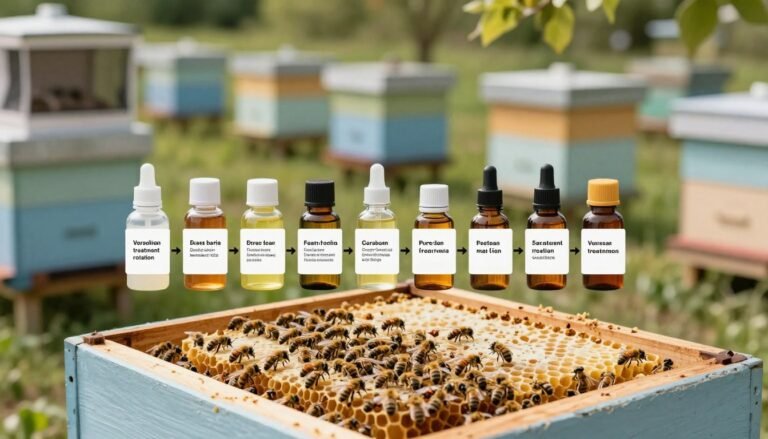
- Adopt an IPM approach combining monitoring, cultural practices, and rotation of controls.
Understanding the Threat of Varroa Mites
Varroa mites have reshaped modern beekeeping by attacking individual bees and entire colonies. These parasites were first described on the Eastern honey bee in 1904 and later became a major pest of the Western honey bee.
Biology of the Mite
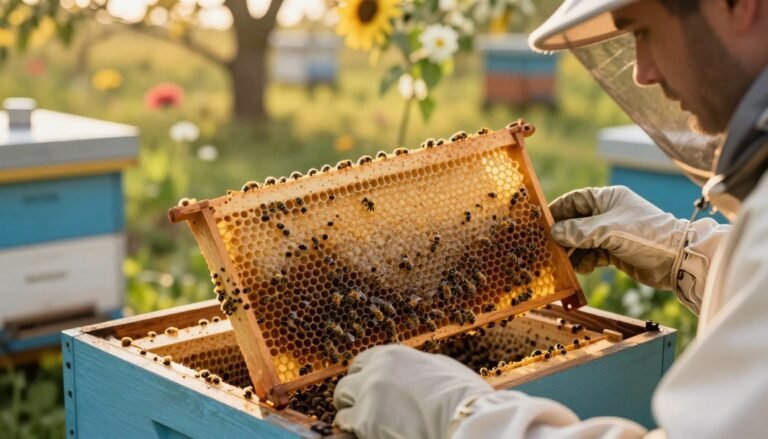
Adult female varroa mites measure about 1.1 mm by 1.5 mm and are visible to the unaided eye. They attach to workers and feed on fat body tissue, which weakens the host and shortens lifespan.
Impact on Bee Development
When mites invade capped brood cells, they reproduce and spread viruses. A single mite can produce several offspring in one cell.
Consequences:
- Emerging bees may be underweight and deformed.
- Worker roles break down as task allocation shifts.
- Overall colony performance and honey production fall.
Early recognition of these signs guides timely checks and treatment validation. For a reliable alcohol wash procedure, see alcohol wash procedure.
Why Regular Monitoring is Essential for Colony Health
Tracking mite levels month by month lets beekeepers act before problems spiral. Regular checks catch small increases in infestation that can blow up by late season.
A colony at 1% infestation in early April often reaches the point of no return by September without prompt treatment. That single fact alone makes regular testing a must for anyone managing an apiary.

- Protect honey production: Consistent monitoring keeps yields steady and colonies strong heading into winter.
- Spot resilient colonies: Identifying hives that manage mites naturally helps plan splits and breeding.
- Prevent viral spread: Monthly checks reduce the chances of viruses that make bees aggressive or prone to absconding.
- Combine weak colonies: Professionals merge struggling units with robust ones before cold months.
Establishing a routine for checking mite and mites levels is a core practice in responsible beekeeping. For deeper monitoring protocols see detailed monitoring guidance, and for validating results after control actions consult post‑treatment count methods.
How to Sample Multiple Hives for Varroa
Gathering a meaningful bee count from several colonies gives a clear view of mite pressure across an apiary.
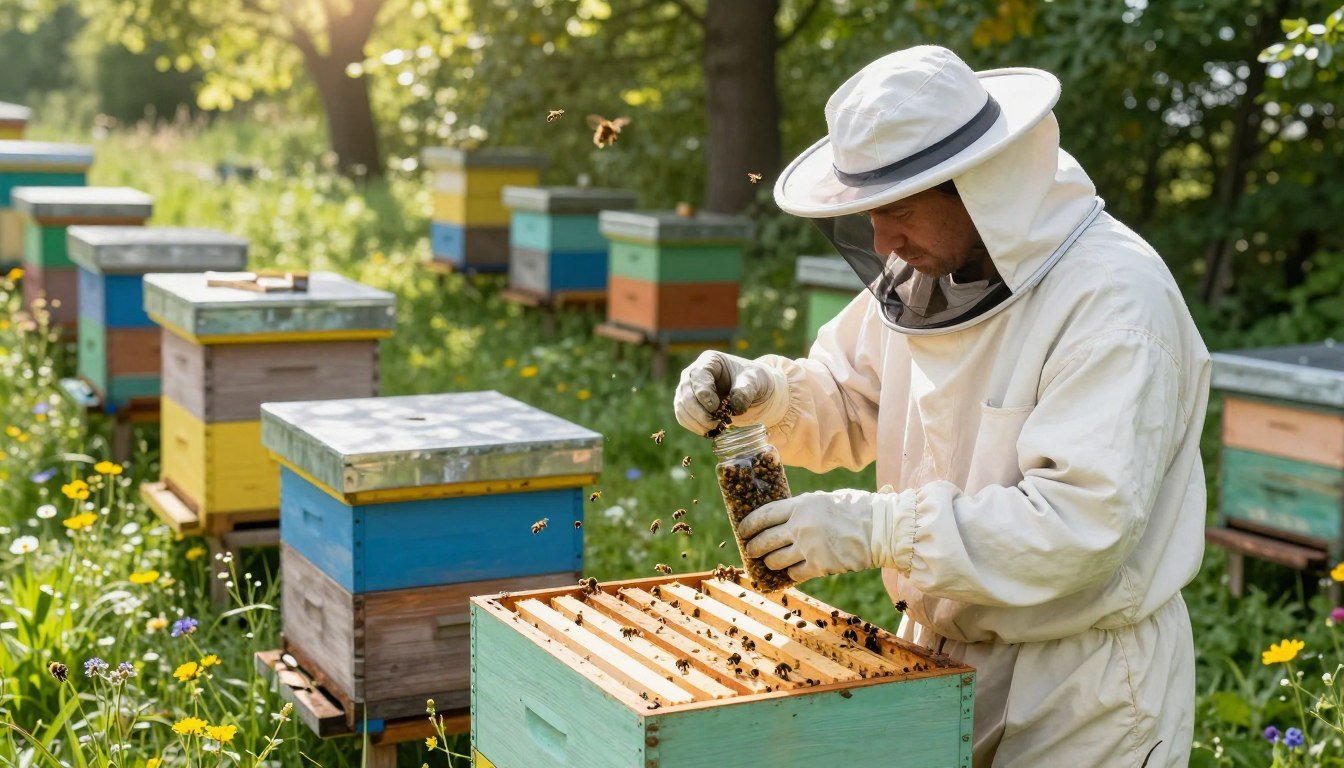
Collect roughly a half-cup of bees—about 300 individuals—taken from the brood area. This number yields a statistically reliable snapshot of infestation.
Hundreds of bees die naturally each day in a full-sized hive. Losing 300 bees for an accurate check is a small, necessary cost to avoid collapse.
When beekeepers take this measure across several units, they can rank treatment urgency and protect strong colonies first.
- Use the brood frame area so nurse bees are represented.
- Repeat the test across several hives for an apiary-wide picture.
- Record counts and compare trends rather than single results.
| Metric | Typical Value | Action |
|---|---|---|
| Half-cup bees | ≈ 300 bees | Use for wash or shake test |
| Daily natural loss | Hundreds of bees | Acceptable test sacrifice |
| Apiary checks | Several hives | Prioritize treatments by results |
| Record keeping | Counts by date | Track trends over time |
For lab protocols and validation, consult the university guide on varroa mite testing. For practical counts per wash see this practical bees per alcohol wash reference.
Selecting the Right Frames for Representative Data
A well-chosen frame gives a clear picture of colony health by showing where nurse bees gather. Pick frames that let you sample bees that are likely carrying mites or entering brood cells.

Locating Nurse Bees
Nurse bees are typically 4–12 days old and spend much of their time on brood. Research by Dr. Tom Seeley highlights their role as primary hosts for varroa mites, making them the target group when checking infestation.
Although many assume nurse bees stay only on brood comb, they move through the hive and visit honey frames. Still, a frame from the upper brood box often yields the most representative mix of bees and brood.
- Choose frames with open or capped brood to increase the chance of finding mites that are re-entering cells.
- Sample an upper brood box frame on a consistent weekly rhythm, since distribution shifts with the week.
- Record which comb or box you used so trends remain comparable across checks.
| Frame Type | Why It Matters | Best Action |
|---|---|---|
| Upper brood comb | High nurse bee density and active brood | Use for representative counts |
| Honey storage comb | Nurse bees transit here; lower brood contact | Avoid as sole source |
| Mixed comb | Provides broader snapshot of hive | Good for cross-checking results |
The Importance of Proper Sampling Technique
A repeatable field routine is the single best defense against undercounting mites. Proper technique affects recovery rates. Few beekeepers consistently reach 90% mite recovery because field steps vary.
Accuracy hinges on how well mites detach during a wash or shake. If you do not agitate the bees firmly and evenly, live mite counts will be too low. That false security risks colony loss later in the season.
Keep procedures identical across every hive. Consistent motions, timed shakes, and the same container size yield comparable results. This consistency lets beekeepers rank infestation and set priorities.
- Rigorous technique gives a true picture of brood and adult bee exposure.
- Insufficient agitation hides mites and underestimates pressure on the hive.
- Standardizing steps cuts human error and improves trend analysis over time.
Take the time needed for full mite recovery. High-quality beekeeping treats monitoring as nonnegotiable. For context on treatment choices and validation, read a concise treatment comparison.
Comparing Alcohol Wash and Sugar Roll Methods
A clear side-by-side look at alcohol and sugar techniques shows why results can vary.

Pros and Cons of Alcohol Wash
Alcohol wash gives consistently higher recovery rates. It is the gold standard used by many professional beekeepers.
The method removes mites reliably from adult bees and delivers repeatable counts. That accuracy helps prioritize treatment and protect brood and honey stores.
Note: the test kills the sampled bees, so plan which worker group you use and limit numbers to a half-cup when possible.
Limitations of Sugar Shakes
The sugar roll is non-destructive and gentler on the colony. It lets you return bees alive after the check.
In high humidity, sugar can clump and reduce mite fall. That lowers recovery and may understate infestation.
During winter or with honey supers present, choose methods carefully to avoid contamination. Each week mite counts can shift, so use the most accurate method available and compare results over time.
- Alcohol wash: higher accuracy, standard in professional practice.
- Sugar roll: non-lethal, but less reliable in some conditions.
- Compare both methods to understand limits of your equipment and improve sampling accuracy.
For guidance on the most reliable method, consult a trusted resource before testing.
Analyzing Mite Infestation Levels
A simple calculation converts mites found into an infestation level the beekeeper can use.
Count the total mites recovered, divide by the number of bees tested, then multiply by 100. This gives the percent infestation for that hive.
Action threshold: In the United States, 3% is the common level at which most keepers act.
Even a small amount of mites in a test can signal growth. Track counts over time to see trends in brood and adult bee health.
- Analyzing mites per 100 bees gives a direct percent that guides treatment choices.
- High numbers indicate colony stress and need prompt intervention to avoid collapse.
- Consistent records reveal whether current practices are controlling populations.
| Metric | Calculation | Interpretation |
|---|---|---|
| Mites per 100 bees | (mites ÷ bees) × 100 | Gives the infestation percentage |
| Low level | ≤ 1% | Monitor; low immediate risk |
| Action threshold | ≈ 3% | Consider treatment and management |
| High level | > 5% | Colony under serious stress |
Record keeping matters. Note date, comb location and brood status each time you test.
For more detailed protocols and method comparison, see the guide on mite monitoring methods.
Seasonal Considerations for Mite Management
Spring warmth and summer brood expansion can trigger explosive mite growth. Populations often rise quickly during active brood cycles and can reach damaging levels within 6–8 weeks if left unchecked.
Spring and Summer Dynamics
Early spring monitoring gives you a real advantage. Treating before the honey flow reduces the need for chemical action during summer and protects honey quality.

Mite reproduction tracks the amount of brood. More brood means more sites for mites to reproduce, so counts may double each few weeks. Watch trends and record counts by comb and by week.
During summer, colonies focus on honey and raising young bees. Be cautious with treatments that risk contamination. Plan interventions around brood breaks or non‑chemical options when possible.
As temperatures fall and brood declines, mite numbers often drop. However, summer damage can remain hidden until winter. Maintain inspection records and follow best practice guides such as the reconnaissance mite sampling for timing and technique.
Interpreting Your Test Results
Correct reading of counts turns raw mites into meaningful management steps.
Start by converting your count into mites per 100 bees. A result of 0–1 mites per 100 bees is excellent. It usually means the colony can ride the season with monitoring and no immediate treatment.
At the other end, 12+ mites per 100 bees signals urgent intervention. Colonies at that level often carry viral loads and may not survive winter without action.

Interpret results by season and brood activity. A slightly higher count in summer may be tolerable while honey is present, but prepare to treat once supers come off. Late‑season counts that climb are especially dangerous.
| Result (mites/100 bees) | Interpretation | Recommended action |
|---|---|---|
| 0–1 | Excellent | Continue routine checks |
| 3 (approx.) | Action threshold | Plan treatment based on region and comb status |
| 12+ | Critical | Immediate treatment and hive support |
Practical steps: compare your number mites with regional action levels and track results by week. If you need a quick reference on reading an alcohol wash result, read an alcohol wash mite count.
Managing Mite Populations Through Integrated Pest Management
Combining breeding choices with routine checks and mechanical controls gives the best long-term defense against mites. Integrated pest management (IPM) uses genetic, cultural, and mechanical tactics to keep infestations below harmful levels.
Key IPM principles:
- Genetic selection: Breed lines that tolerate mites and retain strong brood production.
- Cultural practices: Rotate frames, remove drone comb, and manage colony size to interrupt mite reproduction.
- Mechanical tools: Screened bottom boards, timed brood breaks, and controlled robotized trapping aid control.
Most beekeepers accept a 3% action threshold as the level when chemical treatment becomes necessary. During summer, when mite pressure peaks, IPM helps hold numbers until honey is safe to harvest and winter prep begins.

| Strategy | Effect | When to apply |
|---|---|---|
| Genetic selection | Reduces colony susceptibility | Year-round breeding |
| Drone comb removal | Reduces mite reproduction sites | Spring and early summer |
| Screened floors | Improves natural mite drop | All active season |
| Targeted chemical treatment | Rapid reduction when needed | At or above 3% level |
Avoiding Common Sampling Errors
Minor differences in bee collection and agitation produce large swings in results. Good technique keeps counts honest and helps you pick the right path when numbers rise.

False Negatives
False negatives happen when mites do not detach during a wash or shake. Low agitation, sticky comb, or poor container fit hides mites and gives a falsely low reading.
This risk can lead you to delay treatment and lose colonies. Use firm, consistent motions and check that equipment seals well so mites fall into the collection tray.
Sample Size Accuracy
Using a full half-cup of worker bees gives reproducible results. Too few bees makes percent calculations unreliable and can skew decisions about a brood box or treatment timing.
- Collect bees from the brood area so nurse worker bees are included.
- Keep the same comb location and box across checks to compare trends.
- Record counts and repeat at regular time intervals to spot rising pressure early.
Tip: For guidance on the best time to test, see this concise note on the best time of day to test.
When to Take Action Against Infestations
Deciding when to act can save a colony from rapid collapse. Knowing threshold numbers helps beekeeping choices stay practical and timely.
Quick rule: a test showing 45+ mites per 100 bees usually means the colony is failing and may abscond. Immediate treatment and support are required to rescue brood and honey stores.

Early spring intervention is the most effective step. Treating in early spring keeps mite levels low through the summer and improves the colony’s chance of surviving winter.
Don’t wait until counts rise over weeks. Rising numbers call for decisive treatment that considers brood status, honey supers, and regional guidance.
- Act early: lower numbers are easier to control and protect honey production.
- Act fast: 45+ mites per 100 bees is an emergency signal.
- Record results: track mite counts and treatment dates for better season planning.
| Metric | Interpretation | Action |
|---|---|---|
| 0–1 mites per 100 bees | Low | Monitor |
| ≈3 mites per 100 bees | Action threshold | Plan treatment |
| 45+ mites per 100 bees | Critical | Immediate treatment and colony support |
Conclusion
Routine inspections turn small clues into big gains in colony survival.
Effective monitoring is the cornerstone of successful beekeeping. Regular checks protect bees and keep brood strong through the season.
By using consistent, professional techniques, beekeepers can control mite pressure and preserve honey stores. Record trends, act on clear thresholds, and treat when numbers rise.
Protecting bees means protecting the brood and the colony’s future. Start a steady monitoring routine now to keep colonies resilient and productive for years to come.
FAQ
What is the best way to monitor mite levels across several colonies?
Use a consistent diagnostic method such as an alcohol wash or sugar roll on a standardized sample of about 100 worker bees taken from the brood nest. Test each colony individually and record mites per 100 bees. That gives comparable data for treatment decisions and tracking trends across your apiary.
Why does mite biology matter when checking colonies?
Understanding mite reproduction and preference for drone brood helps target inspections. Varroa reproduce in capped brood cells, so populations rise faster when drones are present. Sampling nurse-age workers near brood frames captures mites that recently emerged from cells and provides a realistic infestation estimate.
How often should beekeepers check their colonies during active season?
Inspect every 4–6 weeks in spring and summer, and more frequently if mite counts rise. Regular monitoring in early spring and late summer identifies growth before it becomes severe. Time checks around treatment windows and before winter preparation.
Which frames yield the most representative bee samples?
Pull bees from frames with open and capped brood where nurse bees cluster. Avoid outer honey-filled frames. Sampling from the brood box near the queen or nurse bee activity gives the most accurate picture of colony mite load.
What are the pros and cons of alcohol wash compared with sugar shake?
Alcohol wash yields consistently high mite recovery and is considered the gold standard for accuracy. Sugar shakes are less lethal and useful for field checks, but may miss some mites and produce lower recovery rates. Choose the method that fits your management goals and comfort with handling bees.
When is a sugar roll preferable despite its limitations?
Use a sugar roll when you prefer a nonlethal test and need quick, on-site results. It’s helpful for small apiaries or educational settings, but interpret results conservatively and confirm high or unexpected counts with an alcohol wash.
How do I interpret numbers of mites per 100 bees?
Compare counts to action thresholds that vary by season and region. In many guides, 3–5 mites per 100 bees in summer signals intervention; higher thresholds apply in spring. Always consider colony strength, brood levels, and treatment history when deciding on control steps.
How do seasonal dynamics affect mite monitoring and control?
Mite populations typically increase through summer with high brood production and peak in late summer or fall. Early spring checks catch overwinter survivors. Adjust monitoring frequency and treatment timing based on these seasonal trends to protect winter bees.
What common sampling errors lead to false negatives?
Sampling from foraging bees or honey frames, using too few bees, or improper mixing during a wash can reduce mite recovery. Always collect about 100 worker bees from brood frames and follow the test protocol closely to avoid underestimating infestation.
How many colonies should be tested to get reliable apiary-level data?
Test every colony when possible. If the apiary is large, sample a representative subset—prioritize weaker or previously treated hives and a random selection of others. Consistent sampling across the same colonies over time improves monitoring accuracy.
When should treatment be initiated after testing?
Initiate control when counts exceed established thresholds for your region and season, or when colony signs indicate stress despite lower counts. Integrate nonchemical options like drone brood removal and screened bottom boards with approved miticides as part of an IPM plan.
How should results influence integrated pest management decisions?
Use test results to guide targeted treatments, rotate products to reduce resistance, and combine cultural controls. Record mite counts, treatment dates, and outcomes to evaluate effectiveness and refine future decisions.
What precautions improve sampling accuracy during field tests?
Standardize sample size, sample location (brood nest), and time of day. Label samples, work quickly to process bees, and clean equipment between colonies. These steps reduce variability and improve confidence in the results.
Can drone removal affect test outcomes and mite pressure?
Yes. Removing drone brood reduces breeding sites and can lower mite population growth. Implement drone comb trapping as part of a broader control strategy, and account for its effects when interpreting subsequent mite counts.