Last Updated September 16, 2026
Organize your hive data fast. This introduction shows why a structured set of sheets makes inspections clearer and decisions easier. Print each page and store entries for each colony in a three-ring binder to keep history tidy and easy to find.
Spending a little time on consistent notes lets managers track health and growth across every field location. With good logs, teams spot trends sooner and adjust care to protect productivity and biosecurity.
Use this guide as the framework for day-to-day notes and for long-term review. For practical tips on measuring outcomes, see how to measure pollination efficiency, which pairs well with these forms.
Key Takeaways
- Print and bind sheets to keep colony files together.
- Consistent entries save time during inspections.
- Field notes help track health and productivity trends.
- Good logs support biosecurity and industry standards.
- The guide provides a practical framework for daily use.
- Linking measurement methods improves decision making.
Table of Contents
- Importance of Pollination Season Record Keeping
- Essential Components of a Pollination Season Record Keeping Template
- Tracking Environmental Indicators and Climate Data
- Monitoring Colony Health and Growth
- Managing Biosecurity and Pest Control
- Selecting the Right Record Keeping System
- Best Practices for Data Collection
- Utilizing National Allergy Bureau Resources
- Analyzing Pollen Season Start and End Dates
- Building a Multi-Year Pollen Date Comparison Table
- Calculating Pollen Season Duration
- Interpreting Elevated Pollen Readings
- Managing Hive Movements and Introductions
- Maintaining Records for Regulatory Compliance
- Storing and Organizing Physical and Digital Files
- Troubleshooting Common Data Gaps
- Conclusion
- FAQ
Importance of Pollination Season Record Keeping
Consistent forms transform ad hoc observations into reliable operational insight. Using simple, standardized sheets helps every farm staff member collect the same data at each visit. This reduces errors and speeds decision making.
Benefits for Farm Management
Good systems let managers compare numbers across fields and greenhouses. Over time, these entries reveal how production and plant health respond to changes in equipment or weather.
Long-term Data Trends
Climate shifts can change pollen timing, increase production, and alter the types of pollen in a location. Tracking trends over years helps an operation adapt planting and sales plans.
- Consistent data flags issues with seed, soil, or equipment before yields drop.
- Standard forms record variety, vegetable and crop outputs, and map areas of concern.
- Analyzing numbers across years clarifies how new plants or land use affect life cycles.
Essential Components of a Pollination Season Record Keeping Template
Every effective farm system begins with forms that capture location, plant health, and output. A compact form should collect who inspected, the exact greenhouse or land area, and the crop variety present.
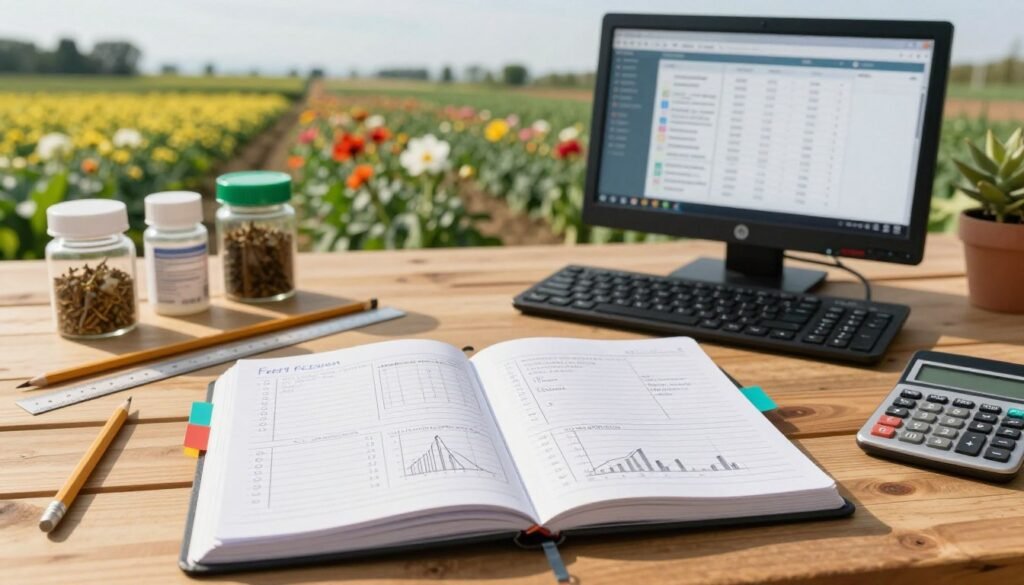
Include fields for seed lot numbers, equipment checks, and simple maps to show plots. This keeps information in order and makes retrieval fast during daily work.
- Health & management: plant notes, pest issues, and treatment dates for clear tracking over years.
- Production & sales: numbers of products, vegetable and crop yields, and sales entries to monitor product flows.
- Location & area: greenhouse bays, land plots, and maps so teams know where to act.
- Operational data: equipment service, seed variety, and example entries for consistent use.
This tool becomes part of routine farming, helping managers spot trends, prioritize repairs, and plan improvements across the entire farm.
Tracking Environmental Indicators and Climate Data
Tracking local climate signals lets farm teams spot patterns that affect plant growth.
How weather shifts alter production
Differences in temperature, wind, humidity, and precipitation across monitors can explain large swings in pollen levels and crop health.
Wind and humidity change pollen production and affect plant health across the farm land. Recording the date and time of each observation helps you link those changes to vegetable and greenhouse growth.
- The State Environmental Health Indicators Collaborative (SEHIC) offers a framework to count days with elevated pollen readings during the season.
- Logging daily weather on a standard form makes it easier to compare numbers over years and improve production strategy.
- Good recordkeeping lets operation managers trace issues to specific seed varieties, equipment, or other life-cycle factors.
Practical tip: keep a short entry each day with time, location, temp, wind, and humidity. Over years, these entries reveal patterns that improve management and boost product numbers.
Monitoring Colony Health and Growth
Daily notes on colony counts and behavior turn vague impressions into hard numbers managers can trust.
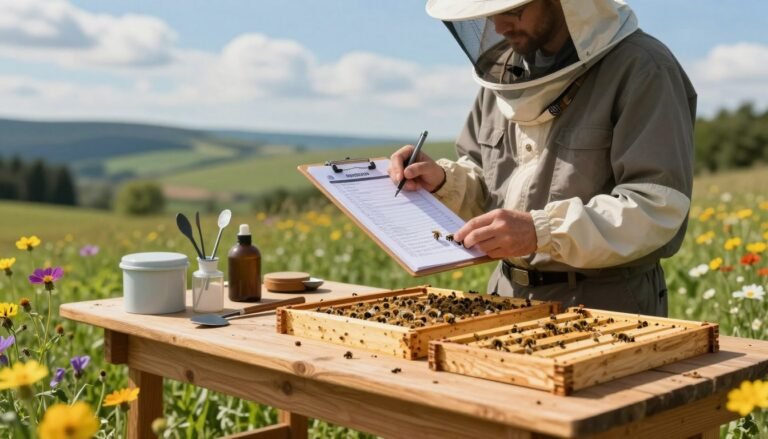
Use the field note-taking sheets to log the number of bees, brood patterns, and food stores each day. These short entries help farm management react quickly to issues.
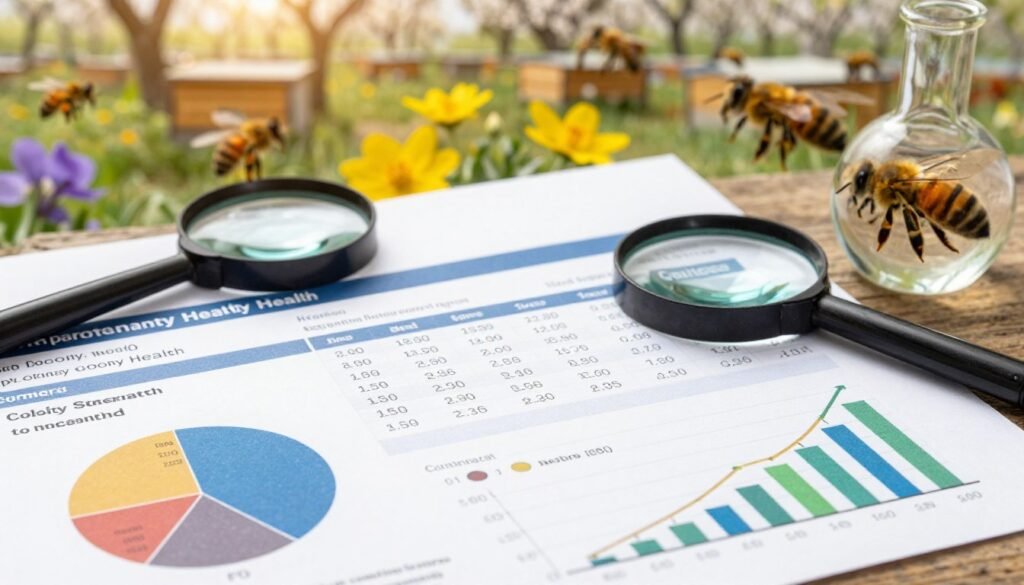
Consistent forms let you compare colonies across fields and years. Over time, these data show trends in crop support and overall production.
- Track hive location and nearby plant variety as part of each entry.
- Record numbers of adults, brood, and notable issues like pests or weak queens.
- Use maps and simple notes to link colony changes to land or greenhouse areas.
Example: a single-line daily form that lists location, counts, plant variety, and equipment checks makes reviews fast and practical.
For a practical inspection form you can adapt, see the inspection checklist and record keeping.
Managing Biosecurity and Pest Control
Farm teams that note detections by time and place cut response time and protect production. Good practice combines quick detection with clear treatment notes so an operation can trace issues and limit spread.
This overview from Valley Beekeeping Supplies covers core bee biosecurity practices — equipment sanitation, detection routines, and treatment documentation — that pair directly with the record-keeping practices described below.
Detection Methods
Document the method used and the exact date and time of each finding. This helps link numbers of pests to a specific field or greenhouse area.
Count the number of pests found and record the crop or plant variety affected. Short, dated entries let managers compare results over years and spot trends in production or health.
Treatment Documentation
Every treatment must include product name, dose, application method, and the location where it was used. Note the seed lot or variety if relevant.
- Keep concise entries for each day a treatment is applied.
- Record follow-up checks and any changes in pest numbers or crop health.
- Store copies of action logs as required by your Code of Practice: a state apiary biosecurity factsheet (Maine Dept. of Agriculture, Conservation and Forestry).
Selecting the Right Record Keeping System
Match the tool to the task: some farms work best with tablets, others with a bound table of logs.

Decide what you must capture and how quickly you need it. Digital systems speed data sharing. Paper tables can be faster when cell service is poor.
Choose systems that save time during busy harvests. A clear layout and simple fields make entries fast. That reduces errors and eases management on the day.
- Pick tools that your crew will use every visit.
- Test how easy it is to update a record after a field walk.
- Consider backup options so reports stay available for years.
Invest now and the system will pay off. Good recordkeeping gives data you can trust for planning, crop choices, and overall operation decisions over the coming years.
Best Practices for Data Collection
Consistent check-ins on the farm turn short notes into actionable business intelligence. Define when staff log visits and what each entry must include. Keep entries brief and in a fixed order so anyone can read them quickly.
Use a standardized tool or table for all fields. A single sheet that captures time, location, crop, plant counts, and any seed or equipment notes saves confusion.
- Daily habit: spend a few minutes each day to update the table and avoid gaps.
- Clear systems: train crew on one method so data are consistent across land and greenhouses.
- Long view: keep logs for years to spot trends in crop health and management choices.
Practical tip: pick a simple tool your team will use every day. Good data collection is the foundation of better farming and smarter decisions about crops, vegetable plots, and seed use.
Utilizing National Allergy Bureau Resources
Certified monitoring networks turn local observations into reliable environmental information.
The National Allergy Bureau (NAB) lists certified counting stations at http://www.aaaai.org/nab/index.cfm?p=displaystationinfo. Use that page to find stations by state via the national map.

Accessing Station Information
The NAB provides a calendar of daily readings for each station. These calendars let you pull specific regional values for planning and analysis.
Why this matters: certified counting stations supply accurate airborne data that researchers and practitioners use to study climate effects and local impacts.
- Practical use: cross-check local readings with your field notes to better understand environmental drivers.
- Use station calendars to track spikes and to time interventions or monitoring visits.
Analyzing Pollen Season Start and End Dates
Establish objective triggers—such as three consecutive days above a threshold—to mark the start and end of the active window.
Begin by aligning daily counts with farm logs and local monitors. Use a consistent threshold so comparisons across fields stay valid.
Practical method: compute weekly averages and flag the first week with sustained elevation as the start. Do the reverse to identify the end.
Document the date, location, and the trigger used. Short entries that list the trigger and the result make later audits fast and clear.
- Record the first sustained rise and the final sustained fall.
- Note any anomalies and link them to weather or farm events.
- Use a published method for verification: analysis approach.
Outcome: clear start and end dates let managers schedule inspections, treatments, and movements with confidence.
Building a Multi-Year Pollen Date Comparison Table
Treat the initial day with a recorded pollen count as the anchor point for seasonal analysis. This start date is the first day in the calendar year when any pollen counting begins, regardless of source.
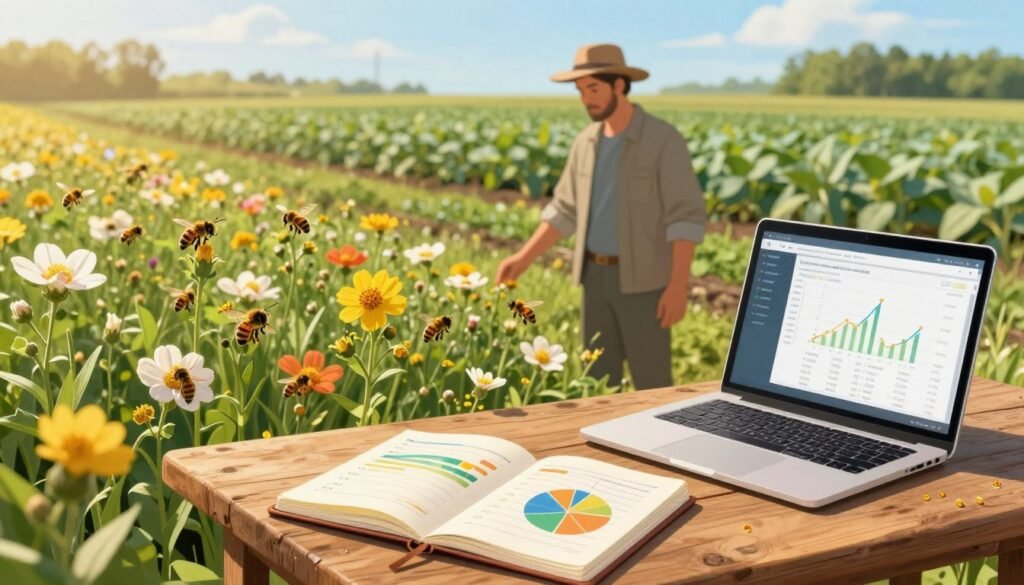
Determining start and end dates helps you understand production cycles for each crop and plant on the farm. By logging the date in a simple table, you track the number of days in the season and compare that data across years.
Accurate record keeping clarifies how seed varieties respond and reveals trends in crop health. Keeping dates in order lets managers plan labor, treatments, and hive or equipment moves with better timing.
| Year | Start Date | End Date | Number of Days |
|---|---|---|---|
| 2023 | 03-12-2023 | 06-05-2023 | 85 |
| 2024 | 03-08-2024 | 06-10-2024 | 94 |
| 2025 | 03-15-2025 | 05-30-2025 | 77 |
Use these simple entries to spot shifts from year to year. Small changes in start or end dates can signal larger shifts in farming conditions and affect production planning.
Calculating Pollen Season Duration
Subtract the start date from the end date to get the total number of days the pollen window was active.
This simple calculation gives your farm a clear number to use in planning. Knowing the length in days helps you assess impacts on crop production and on colony health.
Keep a yearly table that lists start date, end date, and the resulting day total. Over several years, that table becomes valuable data for spotting trends linked to climate or seed choices.
- Why it matters: the day count ties directly to production forecasts and labor needs.
- Practical step: maintain an easy table and update it each day you note a change.
- Benefit: long-term numbers show whether plants and crops shift their active time.
A consistent day total across years gives managers the evidence they need to adapt farming practices.
For more on field-level note taking and durable logs, see field note strategies. Use that guidance to keep your table accurate and useful for future planning.
Interpreting Elevated Pollen Readings
High and very high NAB categories mark readings that deserve immediate farm-level attention. These categories mean airborne counts reached levels that can affect plant health and production.
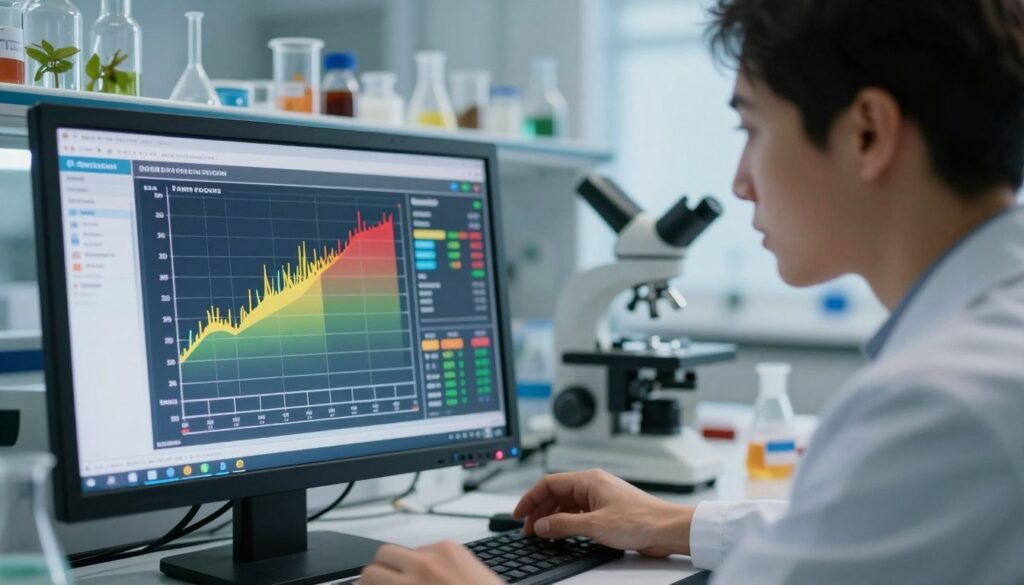
Track the number of days with elevated readings and log each day as an entry in your farm table. A simple table that lists the date, NAB category, and affected crop gives you clear data at a glance.
Over multiple years this data becomes an example of how climate shifts change production rates and plant responses. Use those trends to decide on seed choices and crop rotations.
- Why this matters: documenting each high day links environmental pressure to drops or gains in production.
- How to act: mark high days on your calendar, update the table, and note any immediate field observations.
- Benefit: consistent entries help the farm plan labor, treatments, and hive moves with better timing.
For allergy context and broader airborne counts, see pollen allergy resources. To manage colonies alongside environmental shifts, consult guidance on boosting population naturally at colony management.
Managing Hive Movements and Introductions
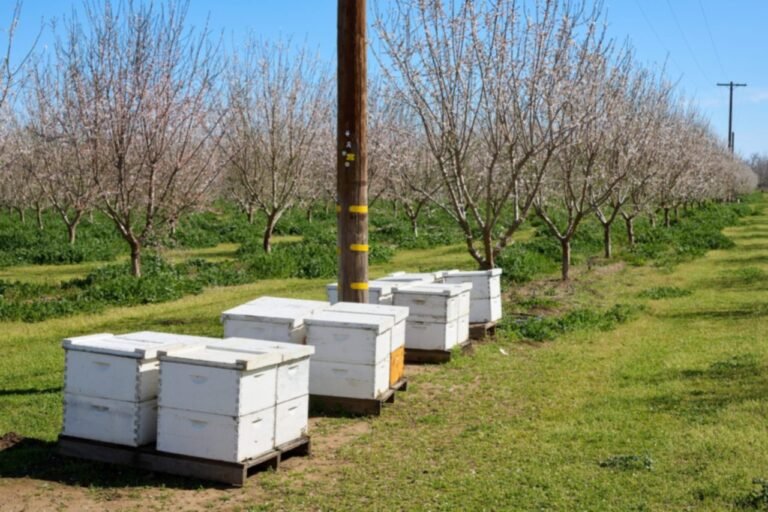
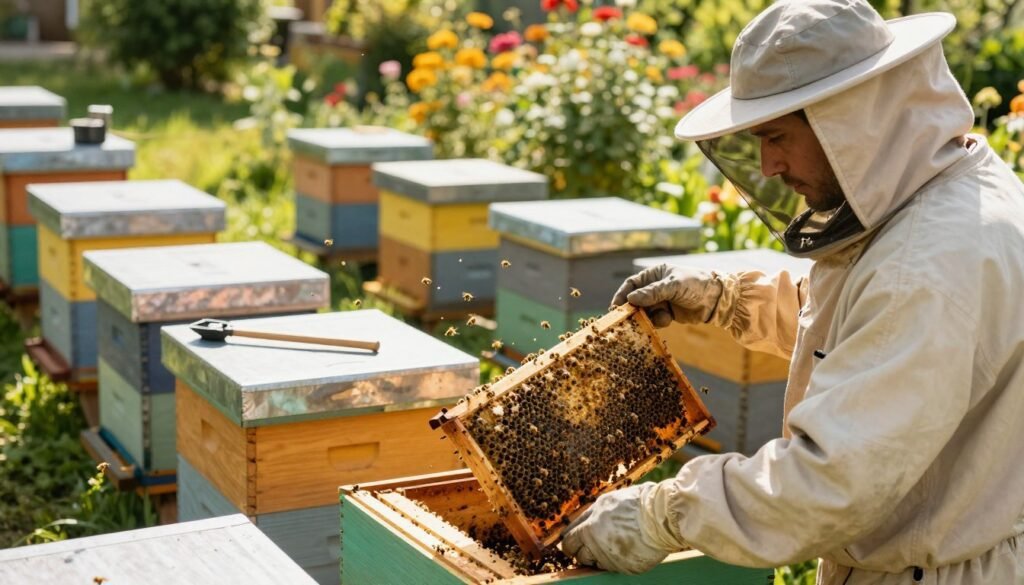
Move plans for hives must list exact dates, counts, and the GPS or field location for clear traceability. This practice protects biosecurity and gives your farm a reliable history of each colony.
Every movement — arrivals, transfers, and departures — should include the date, the number of hives, and the land or field coordinates. Short entries let you trace where colonies were at any time of the year.
Use a simple table to track introductions and movements. Include columns for date, count, destination, crop supported, and notes on condition or treatments.
- Plan by crop: schedule introductions to match vegetable bloom and peak demand.
- Monitor counts: track the number of hives moved and the day they arrived to assess impact.
- Stay compliant: clear entries help your operation meet reporting rules and inspections.
| Date | Number | Destination | Crop |
|---|---|---|---|
| 04-10-2025 | 20 | Field A (GPS: 41.203) | Squash |
| 05-02-2025 | 15 | Land B (GPS: 41.210) | Tomato |
| 05-20-2025 | 25 | Greenhouse 3 | Vegetable mix |
Consistent recordkeeping of hive movements helps you spot patterns across years and respond quickly to issues. For a thorough guide to farm-level logs and forms, see our beekeeping records guide.
Maintaining Records for Regulatory Compliance
Regulatory bodies expect farms to keep clear, retrievable logs that prove compliance and traceability.
Maintain legible entries for every apiary inspection. Each entry should include the date, hive strength, and any pests or diseases found in the field.
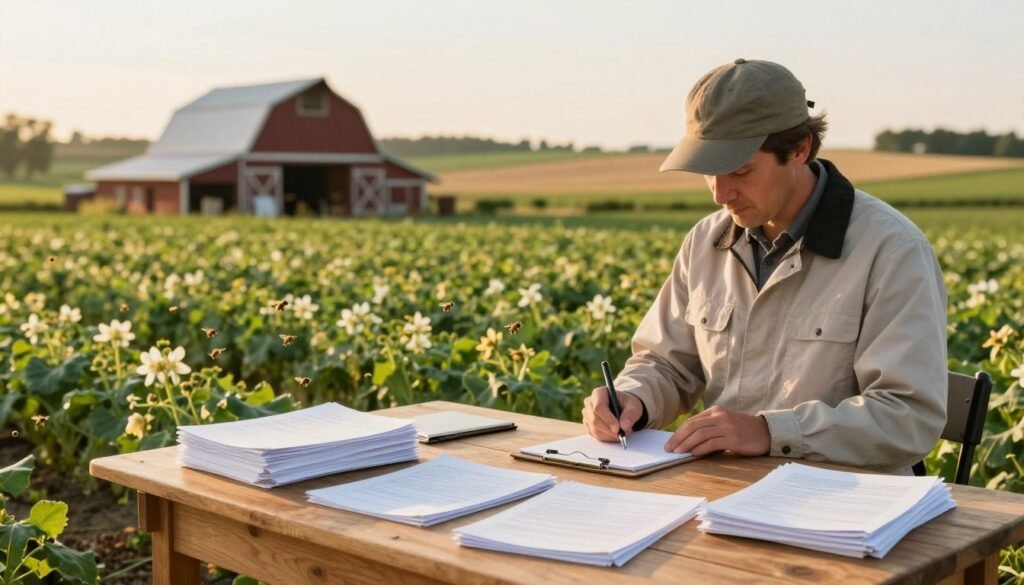
Use a standardized system such as B-Qual to capture required information under the Code of Practice. This ensures your operation stores consistent data for audits.
- Keep concise notes of movements, introductions, and treatments to protect land and plants.
- Retain all records for at least three (3) years to provide a clear history of farm actions.
- Document every hive transfer with date, destination, and the crops or vegetable areas affected.
Tip: a simple table that lists date, location, hive strength, and actions makes review fast during inspections and at year end.
Accurate records are a mandatory part of professional farming and the backbone of biosecurity.
Storing and Organizing Physical and Digital Files
Labeling and a single system make farm information retrievable when you need it most.
Label folders by letters and dates so staff find files fast. Use the same labels in cloud folders to keep physical and digital systems aligned.
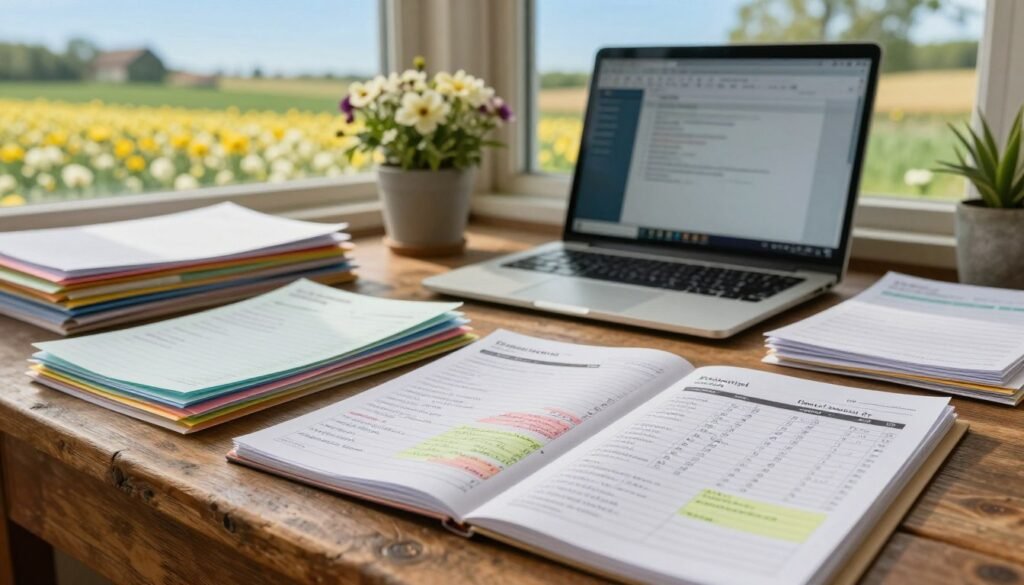
Set aside a short block of time each day to file notes. This daily habit closes gaps and preserves the farm history for future planning.
Keep a visible table of contents in each binder. That table helps crews locate maps, treatment logs, and plant lists at a glance.
| Binder | Label | Contents |
|---|---|---|
| Field Logs | A | Daily visits, maps, plant checks |
| Treatments | B | Products, doses, follow-ups |
| Movements | C | Introductions, dates, destinations |
Tip: back up files weekly and train your crew on one shared system. Good organization makes compliance and day-to-day farming simpler.
Troubleshooting Common Data Gaps
A short, dated explanation for every blank cell preserves the integrity of your data and speeds later review. When sensors fail, staff are sick, or people are away, annotate the reason in your file immediately.

Start each entry with the time, the field or GPS point, and a one-line note describing the issue. This simple habit keeps your operation’s information traceable.
Use a central table that flags missing values and links to follow-up actions. That table makes it easy to spot gaps before they affect crops or plant management.
- Document causes: equipment fault, illness, travel, or software downtime.
- Note corrective steps: sensor repair, recheck visit, or staff reallocation.
- Review weekly: adjust systems and schedules to prevent repeats.
Early identification and concise notes turn gaps into opportunities to improve farm management.
Conclusion
Finish strong by turning your entries into simple, repeatable management habits.
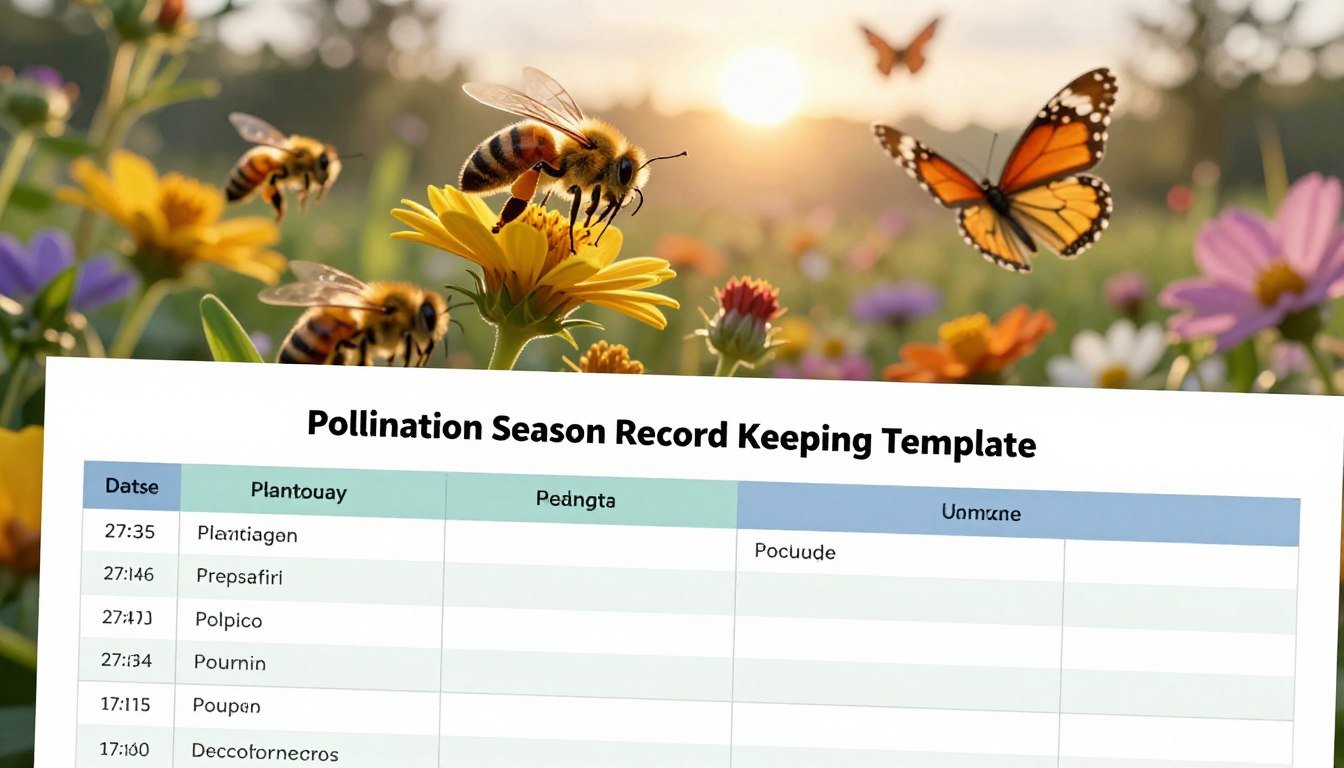
Implementing a clear pollination season record keeping approach is essential for effective farm management and long-term success. Keep entries brief and consistent so your team uses them every visit.
By tracking data each day you can optimize colony health and the growth of every plant on your land. Accurate records let you compare years and make informed choices for the next season.
Well-maintained logs support operational goals and regulatory compliance. Start now: adopt the system, train your crew, and review entries weekly to keep the farm productive and resilient.
FAQ
What is the purpose of a pollination season record keeping template?
A template standardizes how farms and apiaries document key data: production numbers, hive locations, dates of movement, crop varieties, and health checks. This helps teams track performance, comply with regulations, and make data-driven decisions about planting, hive placement, and labor.
What essential components belong in a season record system?
Include date, location (field or greenhouse), crop or plant variety, number of colonies or pollinators used, personnel, equipment IDs, treatments applied, and harvest or product quantities. Attach maps, photos, and lab results for completeness.
Which environmental indicators and climate data are most useful?
Daily temperature, precipitation, humidity, wind, and growing degree days matter most. Combine these with local phenology observations and satellite or station data to predict bloom windows and adjust operations.
What metrics should be used to monitor colony health and growth?
Monitor adult population size, brood pattern, queen status, disease signs, honey stores, and mite loads. Record inspection dates, treatments, and growth rates to detect declines early and measure recovery after interventions.
How should biosecurity and pest control be managed in records?
Log detection methods, sample results, dates of discovery, quarantine actions, products used, application rates, and follow-up checks. Clear entries ensure traceability and support compliance with pesticide or animal health rules.
How are pollen season start and end dates determined for analysis?
Use consistent thresholds such as sustained daily counts above a set value, combined with field flowering observations. Document the criteria used so year-to-year comparisons remain valid.
What records support regulatory compliance for apiaries and pollination services?
Maintain treatment logs, movement permits, purchase and sales invoices, health certificates, and pesticide application records. Keep these organized by year and easily accessible for inspections.
For beekeepers dealing with this, our article on documenting your beekeeping journey: A beginner's guide walks through the details.