A typical honey bee hive holds between 20,000 and 80,000 individuals during the busy season, with a midpoint near 50,000 at peak build-up. This population includes one egg-laying queen, hundreds of drones, and tens of thousands of workers tasked with foraging, brood care, and honey production.
Hive size is not fixed; numbers rise in spring and summer and fall back with cold or scarce forage. The queen can lay up to roughly 2,000 eggs per day during peak periods, driving rapid growth.
Stressors such as pests, pesticides, poor nutrition, or a swarm — which can remove 40–60% of adults — change counts overnight. This guide shows practical ways to read frames and brood to estimate current colony numbers and make sound management choices.
Key Takeaways
- Normal population ranges from 20,000–80,000, often near 50,000 at peak.
- Seasonal cycles and queen laying rate drive most size changes.
- Colony makeup: one queen, many workers, and some drones.
- Health threats and swarming can rapidly cut numbers.
- Use frame and brood checks to estimate strength and plan actions.
- Regional forage and management tune realistic averages; see this update for more context: colony size update.
What You’ll Learn In This How-To Guide
This short guide gives beekeepers clear benchmarks and practical steps to keep colonies strong. You’ll get trusted population numbers, quick checks you can do during inspections, and management moves timed to local nectar flows.
Benchmarks for a healthy population
Learn reliable ranges for spring build-up, summer peak, and fall taper. Expect tens of thousands of workers, a single queen, and seasonal drones that affect overall counts.
“Track frames of brood and entrance traffic to spot growth or decline before it becomes a crisis.”
Actionable steps to maintain optimal size
Use a short checklist: add boxes before congestion, schedule supplemental feed when forage is scarce, and follow evidence-based Varroa controls.
- Read brood patterns to estimate adult strength.
- Watch entrance activity for foraging vigor.
- Plan splits or requeening to prevent swarms and preserve bees.
Recordkeeping completes the cycle: notes on frames, weight, and queen performance make future decisions easier and more precise.
Healthy Hive Numbers at a Glance
A quick glance at population numbers tells you if a colony needs more space or support before stress sets in. This snapshot helps time actions like adding boxes, feeding, or health checks.
Typical range: 20,000–80,000
The standard spread runs from about 20,000 up to 80,000 individuals. Most beekeepers see counts near the mid-range during a good nectar flow.
Common peak-season average: around 50,000
Many sources cite roughly 50,000 as a frequent peak. Some refer to 60,000 bees as shorthand for a strong summer colony, but actual counts vary by forage and management.
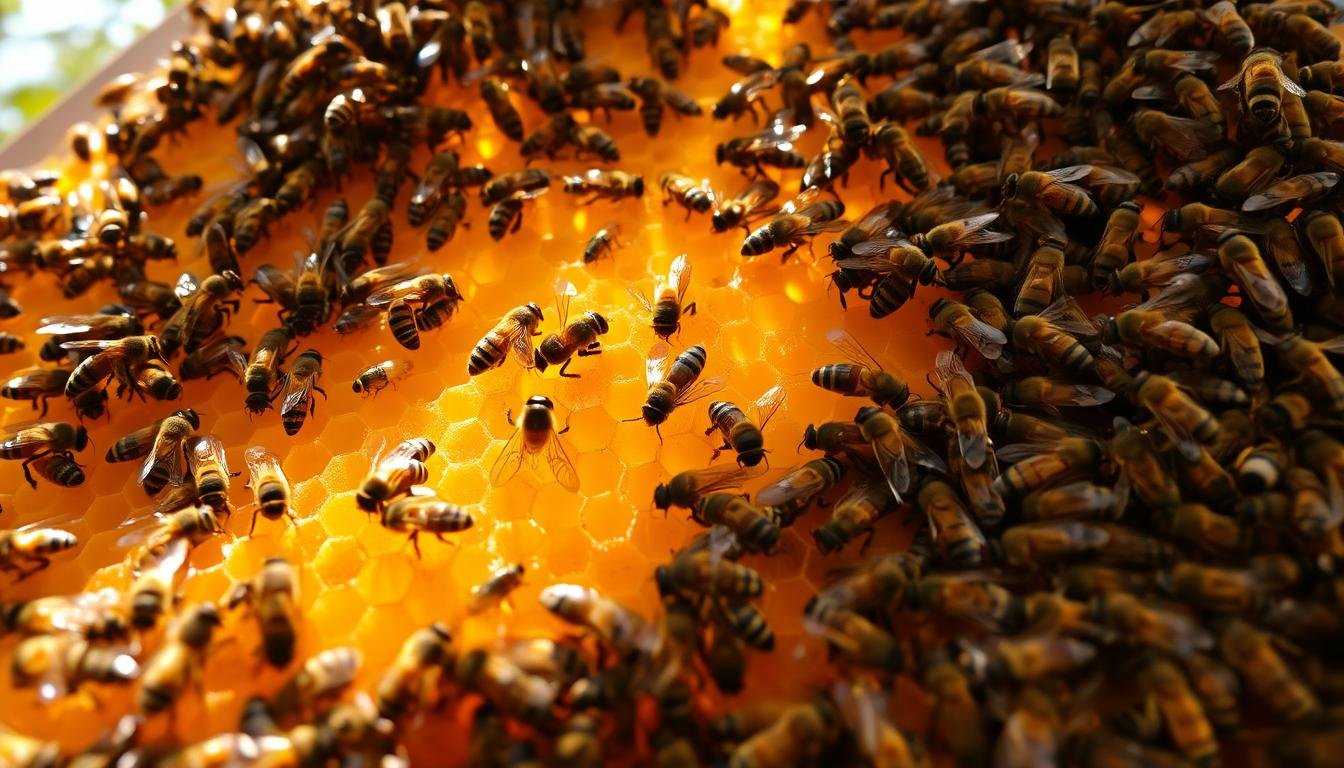
Composition: one queen, hundreds of drones, tens of thousands of workers
At the center sits one queen whose laying output—sometimes up to ~2,000 eggs per day—drives spring buildup.
Worker bees form the bulk of the workforce. They build comb, tend brood, forage, and store honey in cells.
Drones swell in spring and summer and are often evicted before winter to conserve stores.
“Population and caste balance are not fixed; they form a living system that guides management choices.”
- Use frame checks to translate numbers into practical steps.
- Watch for congestion before swarming triggers a sudden loss.
- Plan inspections around nectar flows and health checks.
| Metric | Typical Value | Management Tip |
|---|---|---|
| Peak population | ~50,000 bees | Add supers during strong nectar flow |
| Common shorthand | 60,000 bees | Use as a benchmark, not a constant |
| Caste makeup | One queen, hundreds drones, tens of thousands workers | Monitor queen laying and brood pattern |
| Queen output | Up to 2,000 eggs per day | Record laying rate to predict growth |
For further reading on population benchmarks and resources, see this beekeeping resources and books guide.
39. how many bees are in a healthy hive
Colony headcounts shift with season, forage, and management, so a single number rarely tells the full story.
A typical healthy population sits between 20,000 and 80,000 adults, often near the mid-range during strong nectar flows. Season, local climate, and available forage explain most of the variation.
Summer colonies may host many bees for foraging and storage. By late fall and winter, the same colony can look much smaller while remaining sound. Brood presence, food reserves, and a queen-right state are better health signals than one snapshot count.
Congestion triggers swarming and can remove 40–60% of adults in one event. Disease pressure, especially Varroa and viral loads, can also thin numbers even when the queen keeps laying.
Compare your current estimate to seasonal norms, not a single target. Adding boxes, timing supplemental feed, and managing mites directly affect population trends. For an expanded discussion of swarm behavior and population shifts, see this swarm and hive population guide.
| Indicator | Typical range / note | Practical tip |
|---|---|---|
| Adult population | 20,000–80,000 | Compare to seasonal norm for your region |
| Key health signs | Brood, stores, queen-right | Prioritize brood checks over headcounts |
| Rapid change | Swarm loss: 40–60% | Add space or split to reduce swarm risk |
Understanding Colony Castes and Their Impact on Size
Caste roles inside the colony shape its growth, resource use, and seasonal resilience.
Queen: prolific reproduction sets the ceiling
The queen specializes in laying eggs and can reach peak rates near 2,000 eggs per day. This output creates the potential for rapid spring build-up when workers can rear young quickly.
Worker bees: the workforce that converts eggs to adults
Worker bees perform comb construction, brood care, foraging, and honey processing. Their productivity determines how many of those eggs survive to replace losses and grow the colony.
Strong worker performance boosts stores and supports steady brood rearing. That feedback loop keeps laying rates meaningful and stabilizes population swings.
Drones: seasonal breeders with resource costs
Drones exist primarily to mate. They consume food and occupy space, so colonies cut drone numbers before winter to conserve resources.

- Why it matters: a queen laying near 2,000 eggs per day can only translate to more adults if workers are abundant and healthy.
- Inspection cues: check for eggs, young larvae, and a consistent brood pattern to confirm caste health.
- Management tip: match box space and feed to the colony’s caste balance during peak flows to avoid strain on stores.
| Caste | Role | Impact on size |
|---|---|---|
| Queen | Reproduction; laying eggs | Sets max growth rate |
| Worker bees | Comb, brood care, foraging, honey | Determines survival and reserves |
| Drones | Mating | Seasonal; use resources |
Seasonal Population Curves You Should Expect
Seasonal rhythms drive colony size: steady spring growth, a summer high, then a deliberate fall decline.
Spring build-up and summer peak
As spring arrives, rising temperatures and blooms trigger more foraging. The queen raises laying rates per day to supply workers for nectar and pollen collection.
This creates a workforce that pushes the population toward its summer peak. Add space before congestion to let the hive expand during main flows.
Fall taper and winter conservation of stores
Late summer and fall bring a slowdown. Egg laying drops, brood areas shrink, and the colony focuses on preserving honey stores.
Clustering and minimal brood rearing help conserve resources through cold months. Reduced activity is often normal, not a sign of collapse.
Drone eviction and paused egg laying in cold months
Colonies evict drones as temperatures fall to cut food use. This is a routine preparation step, not always stress-related.
Managers should match inspections and feeding to the seasonal curve. Planning in early spring supports a strong summer peak.
“Match interventions to the season: add supers in bloom, feed in lean periods, and inspect with the calendar in mind.”
- Watch day length and bloom timing: regional variation changes exact timing.
- Read reduced brood in fall as normal unless stores or queen health are poor.
- Use the seasonal tasks checklist to align actions with colony needs.
How to Estimate Hive Size Using Frames and Brood
Estimate colony size by translating frames of bees and brood into likely adult counts. Start with a quick count of frames covered by bees and frames holding brood. Use that to build a rule-of-thumb estimate you can track over time.
Cells per frame and typical brood area
On standard frames, total worker-sized cells per full box can reach on the order of 50,000. In practice, usable comb is lower due to stores and gaps.
Reading brood stages vs. stores
Scan for eggs, larvae, and capped brood cells. Distinguish brood cells from pollen and honey cells to avoid overcounting.
Turning eggs-per-day into adult numbers
If the queen lays 500–2,000 eggs per day, factor in development time and attrition. Many colonies never hold theoretical maxima; 60,000 bees is a seasonal peak, not steady state.
- Count brood frames and note fullness (three-quarters, full brood, patchy).
- Apply a bees-per-frame rule: estimate 2,000–3,000 adult bees per fully covered deep box as a quick check.
- Recheck in seven days to confirm trends rather than a single snapshot.
| Measure | Typical value | Practical use |
|---|---|---|
| Full brood frames | 4–8 frames (varies by season) | Predict short-term growth and need for space |
| Cells per frame (usable) | ~6,000–12,000 per frame area estimate | Adjust for stores and irregular comb |
| Eggs per day | 500–2,000 (queen peak) | Translate to emerging adults with attrition |
Field Signs That Tell You If Your Numbers Are On Track
Use simple field cues to judge whether the colony is trending up, steady, or slipping. Short, repeatable checks during warm, calm weather give reliable context that frame counts alone cannot provide.
Entrance traffic and foraging patterns
Watch flight lines for steady forager flow and note pollen carriers returning to the entrance. A steady stream means enough worker force to support brood rearing and stores buildup.
Low activity on warm, calm days can signal trouble. Always interpret traffic alongside temperature, wind, and bloom timing.
Brood pattern quality and queen-right signals
A compact, consistent brood pattern and visible eggs are clear signs the queen is laying and the colony pipeline is healthy.
Look for multiple frames of brood in all stages. Erratic brood or new queen cells can warn of swarming or queen issues that will change headcount.
Weight gain, nectar flow, and honey stores
Periodic weighing or hefting confirms whether foraging turns into stored honey. Rising weight during a nectar pollen flow shows strong resource conversion.
Keep notes week to week and compare trends. Pair these field signs with external data like field data to plan interventions and anticipate shifts.
How Swarming Changes the Numbers Overnight
When a colony decides to swarm, its population can shift dramatically overnight.

Triggers include brood congestion, dilution of the queen pheromone, and seasonal pressure from rapid nectar flows. Even well-fed colonies will prepare to swarm if space or ventilation is tight.
Immediate impact
A primary swarm commonly removes 40–60% of adult bees. That can drop an 80,000 colony to roughly 48,000 in one day when the leaving queen and cohort depart.
Preemptive management
- Add boxes or open the brood nest early in the season to reduce congestion.
- Watch for queen cups and sealed cells; these are clear warning signs.
- Perform timely splits to keep many bees inside your apiary rather than losing them to the environment.
After a swarm, the remaining hive raises or receives a new queen, creating a brood break that slows growth for several weeks. Beekeepers should balance production goals with swarm control by planning space before peak flows and selecting less swarm-prone stock.
| Action | Effect | Timing |
|---|---|---|
| Add supers / expand brood space | Reduce congestion, lower swarm impulse | Before main nectar flow |
| Monitor queen cells | Early warning of imminent departure | Weekly inspections during buildup |
| Make splits | Retain strength across apiary | When cells observed or congestion noted |
Bee Health Factors That Shrink a Hive
Small, repeated insults—parasites, poor forage, and pesticide drift—chip away at population resilience.
Varroa mites and disease pressure
Varroa and the viruses they carry are primary drivers of decline. Left unchecked, mite loads reduce brood survival and weaken worker bees. That loss cuts the colony’s workforce and slows recovery.
Pesticide exposure and nutrition gaps
Sublethal pesticide exposure impairs navigation and brood development. Poor pollen diversity or long nectar dearths limit nutrition and lower emerging bee quality. Together, these factors depress numbers and honey production.
Stress from moving hives and habitat changes
Frequent transport, habitat loss, and landscape change raise stress and disease susceptibility. Stressed colonies struggle to defend stores or rear brood, and repeated hits compound quickly.
Monitor mites, pair health checks with resource audits, and act early. Prevention beats rescue after collapse.
| Threat | Effect on colony | Action |
|---|---|---|
| Varroa + viruses | Reduced brood survival; weak workers | Regular mite monitoring; evidence-based treatment |
| Pesticides | Impaired foraging and development | Locate hives away from treated crops; test residue when suspicious |
| Nutrition gaps | Poor brood rearing; lower adult quality | Provide forage diversity; supplement in dearths |
| Transport & habitat loss | Chronic stress; higher disease risk | Limit moves; restore nearby forage and shelter |
For practical management steps to keep numbers up, see our expansion tips and align treatments with local bloom calendars.
How-To: Maintain a Thriving Population Through Management
Proactive steps matched to local bloom schedules preserve brood continuity and hive strength. Small, timely moves beat large, late fixes. This section shows practical actions beekeepers can apply during spring and throughout the season.
Right-size the boxes
Add boxes or supers before congestion appears. More space during a main nectar flow reduces swarm impulses and keeps the brood nest intact.
Nutrition planning
Map local bloom timing so feed and supplements match forage gaps. Diverse pollen sources and targeted supplements support nurse bees and larval nutrition during short dearths.
Varroa monitoring and treatment
Monitor regularly and use evidence-based controls timed to brood cycles. Treating at the right moment preserves foragers and reduces viral pressure that shrinks the colony.
Brood nest management
Prevent honey-bound brood by rotating or adding drawn comb. Keep the queen with open laying space so she can sustain steady eggs per day and avoid disruptive brood breaks.
“Right-sizing and consistent checks keep colonies productive and ready for winter.”
| Action | Effect | Timing |
|---|---|---|
| Add supers / drawn comb | Reduce congestion; speed expansion | Before main nectar flow |
| Supplemental feed | Maintain brood rearing during dearths | When local blooms pause |
| Mite monitoring | Protect worker health and stores | Monthly during buildup |
| Rotate brood frames | Sustain laying continuity | During inspections |
Queen Performance, Eggs Per Day, and Realistic Expectations
Tracking the queen’s laying gives the clearest signal of future workforce trends. Inspecting brood patterns and counts over several frames is the most direct way to judge capacity for growth.
Assessing laying rate and brood pattern
Check for eggs and young larvae on multiple frames to gauge the queen’s rhythm. Note whether cells are consistently filled or show repeated gaps.
Practical method: mark three brood frames, record presence of eggs and larvae, then repeat in seven days to estimate eggs per day and brood continuity.
Peak figures may reach roughly 2,000 eggs per day in top conditions, but this is seasonal and rare year-round.
When to requeen for stronger population growth
If brood is spotty, drone-heavy, or eggs count falls sharply, plan requeening to rebuild momentum. A fresh queen with good genetics can restore steady laying eggs and revive stores before major nectar flows.
- Confirm young larvae are absent before declaring queen failure—daily checks can miss tiny eggs.
- Choose replacement queens for gentleness, productivity, and disease resistance.
- Time requeening ahead of main blooms to maximize the colony’s foraging window.
“Sustaining a strong laying cadence matters because worker turnover is rapid; timely requeening preserves adult headcount.”
| Check | What it shows | Action |
|---|---|---|
| Even brood pattern | Vigorous queen and nurse support | Maintain space and monitor |
| Declining eggs per day | Fewer new workers coming | Inspect for pests; consider requeen |
| Spotty brood / many drone cells | Ageing or failing queen | Plan replacement before peak flow |
For planning around local bloom timing and to align requeening with forage windows, consult a regional beekeeping calendar.
Worker Lifespan, Turnover, and Why Numbers Fluctuate
Worker turnover is the quiet engine behind week-to-week shifts in colony headcount.
From emergence to outside flights, a newly emerged worker bee spends its first days on brood care, comb tasks, and cleaning. Next come orientation flights, then a brief, high-risk foraging career.
Marking and RFID studies show many workers never reach that final stage, and foragers can face daily mortality near 36%. These findings explain why bees live short lives at the end of their cycle and why counts can fall fast.
Why steady laying matters
Constant replacement is essential because losses stack quickly. If the queen pauses or brood rearing drops, the adult pool shrinks within weeks.
“Apparent drops often reflect the gap between emerging workers and outbound losses, not sudden collapse.”
- Weather or poor nutrition increases forager risk and reduces incoming resources.
- Strong colonies keep a staged brood pipeline so worker turnover is balanced.
- Plan inspections around trends over time, not single-day counts.
| Factor | Effect | Management |
|---|---|---|
| Forager mortality | High daily loss | Ensure stores and reduce drift |
| Brood pipeline | Replenishes workers | Monitor brood pattern weekly |
| Weather | Spikes attrition | Delay heavy interventions during dearth |
Regional Timing and US Conditions That Influence Hive Size
Local nectar calendars set the clock for colony growth and contraction across the United States. Match actions to bloom windows rather than fixed dates to protect population momentum.
Early flows in warm southern zones speed buildup, while northern yards often see later peaks. Plan supering, splits, and feeding to lead the main flow by a week or two.
Weather and rainfall change the available forage. Drought or prolonged rain can shorten or delay peaks and suppress numbers despite calendar expectations.
Adapting management to local bloom calendars
- Map local blooms and note actual start and end dates each year.
- Coordinate with county clubs or extension services for microclimate insight.
- Tune hive targets to your main flow period and prepare boxes or requeening before it begins.
“Tracking local nectar windows lets you expand safely and avoid stressing the colony during peak demand.”
| Region | Typical timing | Management tip |
|---|---|---|
| South | Earlier spring | Add space sooner |
| Midwest | Mid spring to summer | Time splits before main bloom |
| North | Late spring | Delay major changes until bloom starts |
Recordkeeping: Track Your Hive’s Numbers Over Time
Good records turn daily observations into clear signals that guide timely beekeeping choices. A simple, consistent inspection habit helps you see trends across weeks and seasons.
Why logs matter: recording frames of brood, an estimate of bees per frame, and weight or heft notes links short-term checks to long-term outcomes. Over time, those entries reveal whether a colony is building, plateauing, or declining.
Frames of brood, bees per frame, and hive weight trends
Use a standardized sheet to capture brood frames, per frame estimates, and a quick weight or heft observation each visit. Keep entries consistent so week-to-week comparisons are meaningful.
- Translate brood frames into expected emerging adults by noting full versus patchy frames and adding typical emergence delays.
- Weigh or heft to track nectar intake and storage trends; rising mass usually signals strong foraging.
- Note queen status and any eggs per day proxies, plus queen cells, to flag swarm risk.
Using your notes to predict swarms and plan splits
Combine colony records with environmental notes—weather, bloom intensity, and recent interventions. Multi-week trends show momentum and help you pick the right time to add space or make a split.
“Disciplined recordkeeping turns raw observations into actionable insights for maintaining healthy populations.”
| Record | What to watch | Action |
|---|---|---|
| Brood frames | Full vs. patchy pattern | Plan requeen or splits if pattern falls |
| Bees per frame | Rising or falling estimate | Decide on adding boxes or consolidating |
| Weight / heft | Gain, loss, steady | Feed or harvest based on trend |
| Environmental notes | Bloom intensity, weather | Contextualize numbers and time actions |
Practical tip: mark dates when you added space or split colonies. Comparing those entries with later numbers shows which moves actually improved hive strength. Also compare colonies in the same yard to spot outliers that need attention.
Conclusion
Short-term counts tell part of the story; trends across inspections tell the rest.
Typical population ranges from 20,000 to 80,000 adults, with peaks near 60,000 bees during strong flows. A viable colony centers on one queen plus hundreds of drones and tens of thousands of workers that sustain size and production.
Swarm events can remove 40–60% of adults overnight. Management levers that matter most are space, nutrition, Varroa control, and access to the brood nest. Use the frames-and-brood method to turn inspections into a practical estimate of your hive’s strength.
Keep consistent records, watch seasonal cues, and apply the guide’s diagnostic steps. Evidence-based, timely actions help preserve honey stores, boost overwinter survival, and keep your hives strong.
FAQ
What is a typical population range for a strong honey bee colony?
A healthy colony usually holds between 20,000 and 80,000 adult honey bees, with many hives peaking around 50,000 during the main nectar flow. Numbers vary by season, forage and management.
How does the queen affect colony size and egg production?
The queen drives population growth: a vigorous queen can lay up to about 2,000 eggs per day at peak. Consistent, compact brood patterns signal strong laying and support steady workforce replacement.
How do seasons change hive population curves?
Populations build in spring, peak in summer, then taper in fall as foraging slows. In winter the colony contracts to conserve stores and egg laying drops or pauses in cold climates.
What role do worker bees and drones play in overall numbers?
Workers form the bulk of a colony and handle brood care, comb work, foraging and honey production. Drones appear seasonally for mating and represent a resource cost; beekeepers often see many fewer drones outside mating season.
How can I estimate hive size using frames and brood?
Count frames with solid brood and estimate bees per frame (varies by frame type). Inspect brood in all stages vs. empty cells to judge recent queen activity and extrapolate likely adult counts.
What field signs indicate my colony size is on track?
Watch entrance traffic, steady forage activity, a tight continuous brood pattern, and hive weight gains during flows. These signs show a functioning queen and adequate worker force.
How much can swarming change colony numbers overnight?
A primary swarm can remove 40–60% of adult bees plus the old queen. That sudden loss reduces workforce dramatically and requires prompt management, such as making splits or requeening.
Which health threats most reduce hive populations?
Varroa mites and associated viruses, pesticide exposure, and poor nutrition are primary drivers of decline. Stress from frequent moves or habitat loss also weakens colonies and lowers numbers.
What practical steps keep an apiary population healthy?
Add boxes to prevent congestion, time supplemental feed during dearths, monitor and treat Varroa with evidence-based methods, and manage the brood nest to sustain steady laying and worker turnover.
When should I consider requeening to boost numbers?
Requeen if the laying rate falls, brood pattern becomes spotty, or seasonal buildup lags. A young productive queen helps maintain the egg rate needed to offset worker attrition.
Why do worker numbers fluctuate so much over weeks?
Worker bees progress from in-hive roles to risky foraging jobs; high forager mortality increases turnover. The queen must replace losses fast to keep the colony stable through nectar flows.
How do regional bloom calendars affect colony size?
Local timing of nectar and pollen flows determines buildup speed. Early flows in warm zones let colonies grow sooner; colder or late-bloom areas need adjusted management to match local resources.
What recordkeeping metrics help track hive population trends?
Track frames of brood, bees per frame estimates, and hive weight over time. Consistent notes let you predict swarms, identify declines early, and plan splits or treatments effectively.