This article introduces a practical route to using microscopic analysis to learn where honey comes from and what floral sources it contains. The method is low-cost and fast, but results depend on extraction methods and analyst skill. Early human interest in honey reaches back at least 15,000 years, so this work ties modern labs to deep history.
Scope: the guide lays out a clear, step-by-step workflow. You will get basic lab setup tips, safe staining and mounting advice, and choices for reliable extraction. The focus stays practical while reflecting real laboratory practices.
This article also covers microscopy and simple image analysis as complementary tools. Expect U.S.-focused notes on common seasonal sources and guidance on recording results to support reproducibility. Beekeepers, educators, and hobby analysts will find actionable information to test honey samples and avoid common misreads.
Key Takeaways
- Learn a straightforward workflow to analyze honey and infer floral sources.
- Focus on safe, repeatable lab steps: extraction, staining, and mounting.
- Microscopy and image tools boost accuracy; choose tools to match goals.
- Results depend on method choice and analyst skill—document everything.
- U.S. notes and resource lists help extend learning and practice.
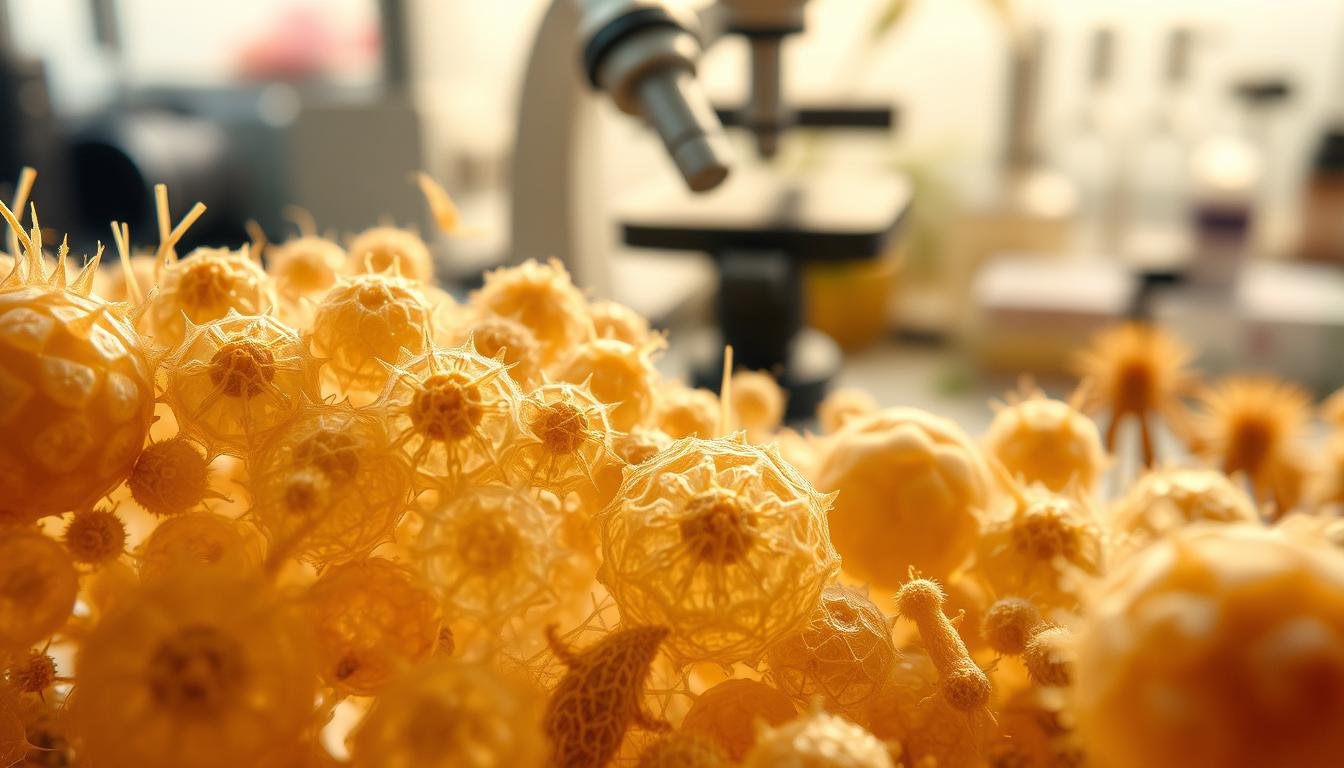
What melissopalynology is and why it matters today
Tiny grain markers locked in honey tell a story about the landscape bees visited. This method is the least expensive and fastest way to infer floral composition and geographic origin of honey, but results depend on extraction technique and analyst skill.
How microscopic grains reveal sources:
How pollen in honey reveals floral sources and geographic origin
Microscopic grains act as botanical fingerprints. They link a jar of honey to local plants and regional flora, helping verify claims like “local” or unifloral types.
Representation varies. Some species shed lots of pollen with nectar, others do not. Bees also filter material while foraging, so counts reflect both plant biology and bee behavior.
Beginner goals: from curiosity to reliable basic analysis
Start with practical goals: learn sample prep, spot major features under a microscope, and record counts and proportions using simple quality checks.
- Set realistic expectations: beginners will identify dominant groups and common taxa, not every species.
- Method matters: better recovery preserves true profiles; poor technique can skew source interpretations.
- Practical value: this information supports traceability, product storytelling, and seasonal forage tracking in beekeeping.
“Standardized sampling and clear documentation turn casual curiosity into repeatable, defensible analysis.”
Use evidence-based steps, document decisions, and acknowledge limits. This article emphasizes safe, repeatable practice as the platform for deeper microscopy or genetic tools later.
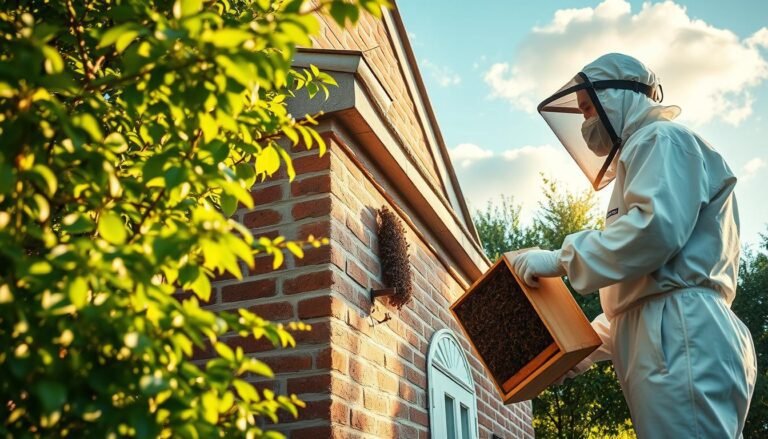
A brief U.S. backstory: from hive robbing to modern pollen analysis
Harvesting honey spans deep time, but American inventions shaped how we manage hives and verify product quality.
Early roots: Cave art such as Altamira shows people collecting wild honey long before modern beekeeping. In the U.S., two 19th-century advances changed everything. Langstroth’s removable frames (1851) made hive management practical. Hruschka’s centrifugal extractor (1865) enabled liquid honey markets.
These shifts increased demand for reliable testing. The USDA’s Young (1908) analyzed U.S. honey to classify types and detect adulteration. He noted that low pollen counts could signal tampering.
Key milestones and methods
Todd and Vansell (1940s) ran controlled experiments on nectar and grains. They found bees can eliminate large portions of grain material during flight. Their work produced coefficient values used to set expected ranges in analysis.
- Langstroth frames enabled routine hive management and sampling.
- Hruschka’s extractor grew the need for authenticity checks.
- USDA and later studies combined chemical and grain evidence to define unifloral honeys.
“Understanding bee filtering and plant-specific differences is essential when interpreting low- or high-grain counts.”
The U.S. literature is smaller than some regions, but contributions by Lieux, White & Bryant, and Jones & Bryant show regional profiles can aid beekeepers and local marketing.
| Year | Innovation | Impact on analysis |
|---|---|---|
| 1851 | Langstroth frames | Better hive management and sampling |
| 1865 | Hruschka extractor | Liquid honey markets; need for quality checks |
| 1908 | Young (USDA) | Classification and adulteration signals (low grain counts) |
| 1940s | Todd & Vansell | Flight filtering; coefficient values for analysis |
As you use this article’s workflow, remember these historical lessons. They guide sampling, extraction, and cautious interpretation of results.
Core concepts beginners must know
What ends up in a jar of honey depends on plant biology and bee behavior. Pollen grains travel on nectar or on bees’ bodies and arrive in the hive mixed into honey during ripening. Their presence gives reliable clues to floral sources when handled carefully.
Pollen grains, nectar, and honey: what gets into your sample
Different plants shed very different amounts of material. For example, fireweed can yield roughly 220 grains/cc while privet may show about 6,130 grains/cc. That natural range affects expected counts in any honey.
Bees also filter material. They can eliminate up to ~90% of some grains during short flights, and larger grains drop out faster than smaller ones. This behavior plus processing loss can distort true floral profiles.
Unifloral vs multifloral honey and “local honey” claims
Unifloral honey is dominated by one floral source; multifloral includes many types. Thresholds vary by species and region, so beekeepers and analysts should record season, hive location, and forage as context.
Sample integrity matters: any lab loss shifts proportions and can mislead conclusions about unifloral claims or local origin. Light microscopy often resolves taxa to family or genus, so think in terms of dominant types and supporting taxa rather than absolute species identification. Later sections outline extraction and mounting steps that reduce artificial loss and improve analysis.
Essential equipment and tools for entry-level pollen identification
Choose practical gear that supports repeatable microscopy work without a large budget.
Core microscopes: start with a bright-field microscope for routine viewing.
Add dark-field or phase-contrast options later to improve edge detail and substructure visibility.
Phase contrast and dark field often boost automatic classification accuracy compared to bright field.
Basic kit: include glass microscope slides and coverslips, a small benchtop centrifuge, graduated pipettes, and general glassware.
Add a vacuum filtration assembly with 25 mm / 3 µm cellulose filters for high-retention extraction.
Dry filter residues at 40°C for ~12 hours, then mount with solacryl or glycerol-gelatin.

Stains, mountants, and safety: glycerol-gelatin with a trace of basic fuchsin is common; phenol can be added as preservative.
Handle basic fuchsin with gloves, eye protection, a lab coat, and good ventilation.
- Camera and capture software for documentation.
- Reference atlases and a local reference library of known honey and plant samples.
- Labeling supplies and sealed storage for slides and reagents.
| Item | Purpose | Specification | Notes |
|---|---|---|---|
| Bright-field microscope | Routine viewing | LED illumination, 40–1000× | Good starter option; affordable |
| Phase contrast / DF accessories | Improved contrast | Phase rings or DF condenser | Add later to improve microscopy results |
| 25 mm / 3 µm cellulose filters | High-retention extraction | Vacuum assembly | Dry at 40°C 12 h; mount with solacryl |
| Glycerol-gelatin + basic fuchsin | Mountant and stain | Small stain volume; phenol optional | Use PPE when handling |
Practice tip: start with bright-field and solid lighting.
Document each slide and keep a local reference set.
This builds skill and makes later analysis more reliable for beekeepers and lab users.
Collecting and preparing honey samples the right way
How you take a sample changes the story the jar tells. Careful selection reduces stratification and gives a truer view of floral input. Record basic context before you open any jar.
Sampling locations in jars and tracing hive sources
Take material from the middle of the jar to avoid top or bottom bias. If possible, pull multiple subsamples from the same lot to check consistency.
Note: track comb position, batch number, and hive ID to avoid source bias. These notes aid later interpretation and reproducibility.
Preparing honey samples versus bee pollen loads
For honey, dilute roughly 1:10 with distilled water and centrifuge to concentrate solids. The wine‑glass sediment method works but centrifugation is faster and more controllable.
Handle bee pollen loads differently: add a drop of water, smear thinly on a glass slide, stain, and mount with glycerol‑gelatin for clear morphology.
- Sprinkle floral reference grains directly on the coverslip for clean comparison.
- Clean tools and use fresh pipettes to avoid cross‑contamination.
- Label every slide with origin, date, and known floral notes.
“Representative sampling and clear labeling are the backbone of reliable analysis.”
| Material | Prep | Speed | Notes |
|---|---|---|---|
| Honey | 10× water dilution + centrifuge | Fast | Best general recovery |
| Bee pollen loads | Drop of water, thin smear, mount | Fast | Preserves grain form |
| Floral reference | Sprinkle on coverslip | Immediate | Clean morphology for ID |
Pollen extraction methods beginners can trust
Reliable recovery starts with choosing the right extraction route and handling samples gently. The choice affects your data and how well slides represent the source honey.
Water dilution and centrifugation: legacy approach and pitfalls
Classic protocols diluted 10 g honey in 20 ml water and spun at ~2,500 RPM for 5 minutes. Historical variation in volumes and speeds creates inconsistent recovery.
Why this can fail: some grains float or remain suspended in water and are lost during decanting, skewing counts.
Cellulose microfiltration (~2–3 µm): high retention
Microfiltration (2–3 µm) retains grains very well and reduces loss. Lutier & Vaissiere (1983) validated its retention but warned filters can clog and slow processing.
Simple workflow: dilute honey, apply to a vacuum manifold, rinse, dry the filter, then transfer residues to glass slides for mounting.
Ethanol (ETOH) dilution to lower specific gravity
Jones & Bryant (2001) showed 10 g honey in 100 ml ethyl alcohol (SG ≈ 0.7) then centrifuge produces reliable pellets. Recovery matches filter results with less clogging.
- ETOH is faster and easier for routine analysis.
- Handle pellets and filters gently to avoid fine-grain loss.
- Document mass, volumes, RPM, and time for reproducibility.
“Practice with a control honey or known spike to test recovery and refine your chosen method.”
Slide staining and mounting basics for clear visualization
Clear mounting makes microscopic views reliable and repeatable across slides. Proper technique helps your glass mounts show true grain shape and internal detail. The aim is a pale, even tint that improves contrast without hiding structure.
Glycerol-gelatin with basic fuchsin: workflow and target tint
Prep the slide: transfer the concentrated pellet or the filter residue to a clean slide. Gently evaporate excess water at low heat so material sticks, but do not over-dry — a little tack helps the mountant hold grains in place.
Mix and apply: warm glycerol-gelatin with a trace of basic fuchsin until it melts. Aim for a pale pink tint; this highlights key features without masking fine detail. Phenol can be added as a preservative to extend slide life.
Drying, warming, sealing, and storage tips
Two practical application methods work well:
- Place a drop of warm mountant on the coverslip and invert it onto the sample.
- Put a small cool blob on the slide and gently warm beneath until it flows and spreads under the coverslip.
Let the coverslip settle slowly to reduce bubbles and distribute grains evenly. Seal edges with clear nail polish only if slides will travel. Many slides remain stable long-term unsealed when stored dry and flat.
“Label slides immediately with sample ID, date, and stain to keep records useful for later analysis.”
Safety: handle basic fuchsin with gloves, eye protection, and ventilation. Avoid skin contact and spills. Photograph representative fields at consistent magnification to build a reference library and check stain intensity.
| Step | Purpose | Key tip |
|---|---|---|
| Transfer concentrate | Place material on slide | Evaporate residual water gently |
| Apply glycerol-gelatin + fuchsin | Mount and tint grains | Pale pink tint; add phenol if desired |
| Coverslip placement | Even distribution | Invert warm mountant or warm slide gently |
| Seal & label | Transport and records | Optional nail polish; label immediately |
Microscopy techniques compared for pollen grains in honey
Different light paths and condensers reveal contrasting features on the same grain. This short comparison explains how three common optics change what you see and how automated systems perform on honey samples.
Bright field: standard method and limits
Bright field is the standard in many harmonized protocols. It is accessible, easy to use, and reliable for routine counts.
Its limitation is lower contrast on dense or transparent exines, so fine surface detail can be missed. Automated analysis using bright field reached ~88.88% correct on stacked images.
Dark field: edges and tiny structure visibility
Dark field uses oblique illumination to boost edge contrast and make small surface elements pop. This helps both human observers and machine classifiers detect subtle texture.
Dark field delivered ~91.02% automated accuracy when images used extended depth of focus (EDF) from multiple planes.
Phase contrast: best discrimination for transparent specimens
Phase contrast enhances phase boundaries inside transparent grains. It reveals internal detail and peripheral features that bright field may hide.
In controlled tests with EDF and consistent lighting, phase contrast led at ~93.05% correct classification. That makes it the top choice where budgets and equipment allow.
- EDF stacking from 5 focal planes improves feature extraction across all techniques.
- Start with bright field and add phase rings or a DF condenser as skills and funds grow.
- Standardize lighting and document the technique used for each slide to aid repeatable analysis and clear reporting.
“Comparing the same field across techniques reveals which features are technique-specific and which are true morphology.”
Automated image analysis for beginners: where to start
Using simple imaging converts microscope views into repeatable measurements you can trust. Start small and focus on consistent capture. Good images make analysis reliable and speed the path from slide to result.
From images to features: shape, color, texture, and EDF
Capture five focal planes and use extended depth of focus (EDF) to combine them. EDF improves edge and surface detail so shape and texture descriptors work better.
Automated pipelines measured 30 descriptors: 2D/3D morphology, RGB/hue/brightness, texture metrics, and EDF values. Standardized lighting and a 25 mm/3 µm filter with solacryl mounts kept results consistent.
Simple beginner workflow and results
Minimal steps: fixed magnification, uniform light, save raw files, then run basic segmentation to extract size, roundness, and color. Keep a small labeled reference set of local pollen and honey slides to train personal classifiers.
“Automated outputs are decision support. Human review stays essential.”
| Step | Key output | Why it matters |
|---|---|---|
| Capture (5 planes) | EDF image | Better feature extraction |
| Measure | 30 descriptors | Numeric profiles for comparison |
| Classify | Factor/discriminant | Ph 93.05%, DF 91.02%, BF 88.88% |
Note: DNA methods are powerful but costlier. Automated microscopy analysis provides accessible, cost-effective support while you build skills and data records.
Melissopalynology for beginners (pollen identification): a step-by-step workflow
Good results come from a repeatable chain: select and label samples, choose an extraction method, mount and stain, then image and record results.

Extract, mount, image, identify, and record
Select samples from the middle of jars and note hive, batch, and date. Choose either cellulose microfiltration (~3 μm) for maximum retention or ethanol dilution (10 g in 100 ml ETOH, SG ≈ 0.7) with centrifugation for fast, consistent pelleting.
Mount using warm glycerol-gelatin with a trace of basic fuchsin; add phenol if long-term preservation is needed. Warm gently to avoid bubbles and keep a pale tint for clear views.
Building and using a reference set for comparison
Image at fixed magnification, capture multiple focal planes, and use EDF stacks for automated and manual analysis. Scan several fields, tally dominant types, and cross-check with local reference slides and atlases.
When to seek expert confirmation
- Conflicting features or ambiguous grains.
- Suspected adulteration or critical labeling claims.
- High-stakes results used by beekeepers or markets.
“Keep detailed logs: method, volumes, RPM, stain, imaging mode, and counts.”
| Step | Choice | Key parameter |
|---|---|---|
| Extraction | Microfiltration | 25 mm / 3 μm filter |
| Extraction | ETOH dilution | 10 g : 100 ml; centrifuge |
| Mounting | Glycerol-gelatin + fuchsin | Pale pink; warm carefully |
| Imaging | EDF (multi-plane) | Consistent magnification & lighting |
Reading results: counts, proportions, and concentration data
Raw counts need context to become reliable measures of floral contribution in a honey sample.
Why conversion matters. Count the grains in multiple fields, then convert to proportions by dividing each taxon count by the total counted. When you know the volume or mass processed, you can compute concentration (grains per gram or per milliliter).
How loss skews profiles. Loss during extraction or transfer removes grains unevenly. Think of it like discarding part of a mixed bag and expecting the same ratios. Large grains or sticky residues can be lost more readily, and bees may already have eliminated up to ~90% of some grains during flight.
Minimizing loss and improving trust
- Use high-retention methods (microfiltration or careful ETOH centrifugation).
- Avoid over-decanting and handle pellets and filters gently.
- Run a recovery control or tracer on unfamiliar matrices.
Interpreting dominance and unifloral claims
High dominance of a characteristic taxon plus supporting minor types suggests a single-source honey. Do not rely on a single threshold alone. Consider season, region, and known plant abundance when judging claims.
“Repeat counts on multiple fields and on replicate slides to build confidence in reported percentages.”
| Step | Output | Why it helps |
|---|---|---|
| Field counts (n fields) | Raw counts | Reduces sampling error |
| Convert to proportions | Percent by count | Shows relative dominance |
| Use processed volume | Concentration (grains/g) | Compare batches over time |
Reporting to beekeepers. Summarize dominant types, likely floral sources, and any caveats from observed losses or ambiguous grains. Document uncertain items separately instead of forcing identification. That keeps your analysis and data defensible.
Authenticity and origin: beyond the light microscope
Chemical and molecular tests extend what a slide can show, helping verify labels and detect fraud. Use these tools when you need stronger proof than counts alone.
Stable isotope ratio checks and limits
Stable isotope analysis compares carbon, hydrogen, nitrogen, and oxygen ratios to spot cane or corn syrup adulteration.
This works well for C4 sugars (corn, cane) but can miss beet or rice syrups. Isotope values also suggest broad climate or environmental signals but rarely pinpoint an exact region.
DNA barcoding and sequencing
DNA barcoding and amplicon sequencing can recover plant taxa from honey and pollen pellets. These tools complement microscope work by naming taxa that are hard to see.
Current limits include incomplete reference libraries and amplification bias. Labs and equipment access may restrict routine use for small-scale analysts.
3-D synchronous fluorescence spectroscopy
3-D fluorescence captures phenolic fingerprints tied to floral and geographic patterns. It is a fast, non-targeted screening tool useful in research and commercial testing.
“Layered testing—microscopy first, then isotope, dna, or spectroscopy when needed—gives robust results.”
Practical advice: collaborate with universities or commercial labs for advanced tests. Store slide images, aliquots, and metadata so you can run follow-up analysis and integrate results into a clear report that ties counts and advanced data into one coherent narrative.
| Technique | What it detects | Strength | Limit |
|---|---|---|---|
| Stable isotope analysis | Added sugars; climate signals | Good for cane/corn syrup | Misses beet/rice; low geographic precision |
| DNA barcoding & sequencing | Plant taxa in honey and pellets | Taxon-level evidence | Library gaps; amplification bias; cost |
| 3-D fluorescence spectroscopy | Phenolic floral fingerprints | Rapid, non-targeted screening | Requires calibration and reference models |
| Light microscopy | Visual counts and morphology | Cost-effective; local context | Limited taxonomic resolution |
Safety, ethics, and data quality for beginner analysts
Protecting yourself and the chain of custody keeps results credible and usable. Personal safety and clear records are essential when you handle stains and preservatives that can harm skin or lungs.
Handling phenol and basic fuchsin
Use PPE: nitrile gloves, safety goggles, a lab coat, and local exhaust ventilation when mixing or heating basic fuchsin or phenol-preserved glycerol jelly.
Avoid skin contact and keep a spill kit nearby. Store chemicals in labeled, locked cabinets and follow local waste rules for disposal.
Transparent documentation and reproducible methods
Write simple SOPs that cover sampling, extraction, staining, imaging, and storage. Calibrate microscopes and timers regularly to keep equipment performance consistent.
- Give each sample a unique ID and keep a dated stepwise log.
- Name image files with ID, magnification, and date, and back up files securely.
- Run known controls periodically or join informal inter-lab checks to verify recovery and method consistency.
Ethics: report methods, limits, and uncertainties clearly in any article or report. Do not assert species-level matches without robust reference evidence.
“Transparency in safety and data practices builds trust with beekeepers and consumers.”
U.S.-focused tips: common pollen types and seasonal sources
Regional floral calendars shape what shows up in a jar of honey across the United States. Spring often brings tree bloom signatures, summer adds clover and wildflowers, and fall yields mixed composites.
Regional plants frequently seen in American honey
Common contributors include clover and blackberry in many temperate zones, tulip tree and maples in eastern states, citrus and orange blossom in the Southeast and California, and mesquite in the Southwest.
Ornamental and crop plants in cities and suburbs—like ornamental acacias or lawn clovers—also show up, shifting signatures from rural expectations.
Practical tips for beekeepers:
- Build a local reference set by sampling known local honey and nearby blooms.
- Log field observations: bloom timing, dominant plant species, and foraging behavior.
- Share slides and notes with local associations to speed recognition of frequent pollen types.
“Absence of an expected grain does not always mean no nectar contribution; some species produce little measurable material.”
| Region | Common plant contributors | Peak season |
|---|---|---|
| Northeast / Mid-Atlantic | Clover, tulip tree, blackberry | Late spring—summer |
| Southeast & Florida | Orange blossom, citrus, wildflower mixes | Spring—early summer |
| Southwest | Mesquite, creosote, introduced ornamentals | Spring—early summer |
| Midwest / Plains | Clover, alfalfa, mixed wildflowers | Summer |
Keep records each year. Weather and planting trends change which species dominate. Use field logs to align lab analysis with real-world forage and treat unifloral claims cautiously if blooms overlap or apiaries move.
Next steps: learning paths, references, and practice ideas
Set a clear plan that mixes short study sessions, hands-on practice, and peer feedback. Start with a focused reading list, build a small slide library, and commit to weekly drills that sharpen observation and recording skills.
Recommended atlases and practical references
Key texts: look for Sawyer, Erdtman, and Ricciardelli D’Albore in libraries or used markets. Add modern online atlases and recent article archives to stay current.
Build a personal slide library and practice routine
Create labeled slides from local flowers, bee pollen loads, and verified honey for side-by-side comparison. Keep clear labels with date, location, and method.
- Practice drills: identify 10 unknown grains per slide, verify against references, and note confidence.
- Schedule: one honey sample per week, one bee pollen load, and one flower set.
- Upgrade equipment slowly—better lighting, phase contrast, or a camera adapter improves results.
“Steady, structured practice and comparison with published analysis turn study into reliable skill.”
Join regional beekeeping groups or extension workshops to get feedback and swap anonymized slides. Keep a learning journal to track new taxa, misidentifications, and progress over time.
Conclusion
A clear, repeatable workflow turns raw samples into actionable insight about honey and its sources.
Melissopalynology remains an efficient approach: careful sampling, microfiltration (~3 μm) or ethanol dilution (10 g/100 ml, SG ≈ 0.7), gentle handling, and pale glycerol‑gelatin mounts give credible pollen results and basic analysis.
Phase contrast and dark field improve visualization and help automated tools, while a personal slide library and strict documentation preserve information and reproducibility.
Layer isotope, DNA, or fluorescence tests when light‑microscope limits affect important claims. Keep safety, ethics, and clear reporting at the center of your work.
Thank you for reading this article. Prepare one slide this week, document the process, and compare it to a trusted reference to build confidence in your methods and support beekeeping and consumer trust.
FAQ
What is the goal of this guide?
This guide teaches basic methods to extract, mount, and view pollen grains from honey and bee-collected loads so hobbyists and beekeepers can learn floral source and regional patterns with reproducible techniques.
Which core tools do I need to start identifying pollen?
Start with a quality compound microscope (bright field is fine), glass slides and coverslips, micropipettes, centrifuge or filters (~2–3 μm), stains such as basic fuchsin, glycerol-gelatin mountant, and reference atlases or image libraries.
How should I collect honey samples to avoid biased results?
Take sealed, clean jars from multiple frames or extracted batches, avoid frames with cappings or heavy brood contamination, and label samples with date, hive, and location. Pooling several sub-samples can reduce single-frame bias.
What simple extraction methods work for beginners?
Reliable entry-level options include water dilution followed by centrifugation, ethanol dilution to reduce specific gravity, and cellulose microfiltration around 2–3 μm for high pollen retention. Each method has trade-offs in recovery and ease.
When should I use staining and how do I mount slides?
Stain with basic fuchsin or similar to highlight exine sculpture. Mount in glycerol-gelatin, warm to set, then seal edges for storage. Proper drying and sealing extend slide life and ensure clearer features for ID.
Which microscopy mode gives the best pollen detail?
Bright field is the standard and easiest. Dark field highlights outlines and tiny structures, while phase contrast improves internal detail and discrimination—use phase contrast when you need more confident taxonomic separation.
How do I build and use a reference set for comparison?
Collect fresh anther or flower samples, prepare slides the same way as honey pollen, and document images, location, and date. Catalog images by shape, size, and surface texture for side-by-side comparison with unknowns.
How accurate is automated image analysis for pollen?
Beginner-friendly automated systems report good performance: reported accuracies include phase contrast ~93%, dark field ~91%, and bright field ~89%. Automated tools speed processing but still need human verification for novel taxa.
How do I interpret counts versus concentration data?
Counts give relative composition (percent of total observed), while concentration (grains per gram) shows absolute pollen load. Loss during extraction can skew profiles; include controls and recovery tests to correct estimates.
When should I seek expert confirmation or lab testing?
Ask an expert when results influence commercial labeling (unifloral claims), legal origin disputes, or when microscopy yields ambiguous taxa. Accredited labs offer stable isotope, DNA barcoding, or advanced microscopy for higher certainty.
Are there safety concerns with stains and chemicals?
Yes. Use PPE when handling phenol, basic fuchsin, and solvents. Work in a well-ventilated area, follow material safety data sheets, and dispose of chemical waste per local regulations to protect health and data integrity.
Can I analyze bee-trapped loads the same way as honey samples?
Bee-collected pollen pellets require different preparation; they can be washed, sieved, or diluted before mounting. Results tend to reflect foraging plants more directly than honey, which mixes nectar and airborne grains.
What common U.S. plants will I likely see in honey pollen surveys?
In North America, expect clover, goldenrod, maple, oak, chestnut, aster family members, and various tree pollens depending on region and season. Regional field guides help narrow likely candidates.
How do I avoid repeating the same keyword too often in notes or reports?
Vary phrasing: use terms like grains, loads, taxa, floral sources, or honey types. Keep descriptions concise, and record scientific names to maintain clarity without overusing single words.
What learning resources help accelerate skill building?
Use pollen atlases (such as those from the American Academy of Microscopy), peer-reviewed articles, university extension guides, and hands-on practice with flower samples. Join beekeeper associations for regional knowledge and sample exchange.