This report examines how modern agriculture in the United States became dramatically more toxic to insects and what that means for managed honey bees. We trace a national rise in chemical toxicity between 1992 and 2014 and show why systemic chemistries, especially neonicotinoids, drove most of the change.
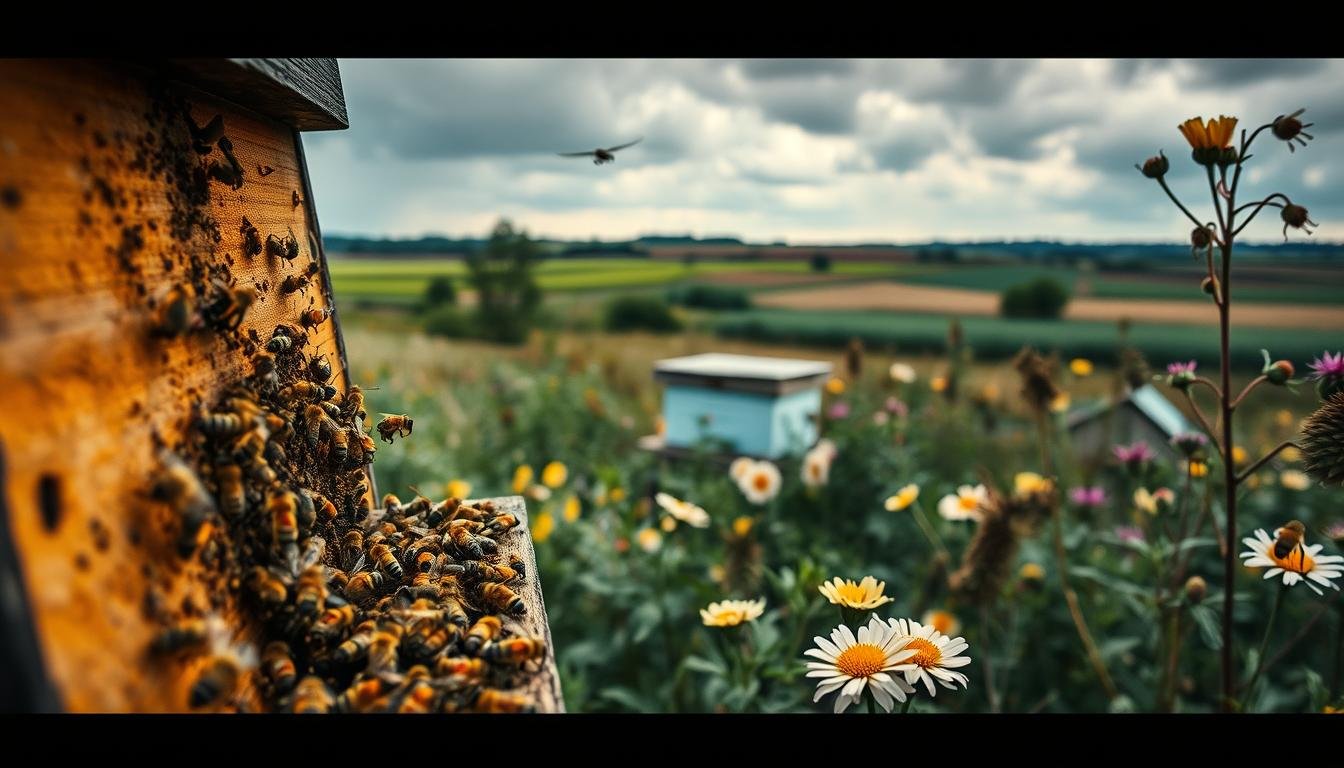
Neonicotinoids are plant‑systemic and persistent, moving into pollen, nectar, leaves and water and lasting months to years in soils. Field reports from commercial apiaries describe lethal kills from planting dust during corn seeding and large colony losses reported by beekeepers.
The analysis links historical use, mechanistic toxicology, regulatory action and beekeeper experience. We compare EU restrictions in 2018 with U.S. agency steps and ongoing legislation, and we place managed honey bees in a broader ecological context.
Use this report to understand past trends, current risks, and practical steps that can help sustain pollination services and hive resilience. For methods and broader wild‑bee findings see a national study here: national analysis of pesticide effects.
Key Takeaways
- Major rise in toxicity: Agricultural chemicals surged in toxicity across recent decades, with neonics as the main driver.
- Systemic exposure: Residues appear in pollen and nectar, raising chronic and sublethal risk for bees.
- Real-world harms: Beekeepers report acute colony losses linked to planting dust events.
- Policy contrast: The EU moved earlier to restrict neonics; U.S. measures are more recent and partial.
- Report scope: Focus on managed honey bees while noting implications for wild pollinators and ecosystems.
Executive overview: Past trends shaping pesticide impacts on U.S. bees
Across recent decades, farm chemical use shifted from short‑lived sprays to long‑lasting, plant‑absorbed compounds that change how bees encounter toxins.
The USDA/EPA (2013) joint study noted multiple stressors for bee health and uncertainty about relative roles. It also acknowledged severe harm from high‑dose exposures and from drift onto attractive flowers.
Use patterns evolved: seeds and systemic formulas now move into nectar and pollen, creating chronic exposure pathways. This change shifted research from acute contact toxicity toward chronic, sublethal, and cumulative effects that affect foragers and brood.
Seasonal timing and planting practices intersect with foraging behavior. Dust during planting and persistent residues extend exposure windows for colonies across years.
“Multiple stressors complicate clear attribution, even as national loss trends show about 30% overwinter losses since 2006.”
| Exposure route | Timing | Typical residues | Risk note |
|---|---|---|---|
| Nectar & pollen | Post-planting weeks | Low but persistent | Chronic effects on foragers |
| Planting dust | Seed sowing events | High short-term spikes | Acute kills reported |
| Soil & water | Months to years | Detectable residues | Extended exposure window |
What follows: the report moves from historical context to mechanisms, quantification, regulatory tools, and practical mitigation. This analysis links science, policy, and beekeeper experience to help guide action while noting data gaps across crops, regions, and years.
From arsenic dust to neonics: A historical arc of pesticides and beekeeping in the United States
Mid‑century chemicals left clear traces: foraging bees often carried arsenic dust back to hives, triggering visible colony losses in the 1950s.
By the 1970s, microencapsulated formulations such as PennCap‑M® changed exposure modes. Tiny capsules resembled pollen and delayed harm until nurse bees ingested contaminated material while feeding brood.
1950s arsenic dust, microencapsulation, and early losses
Microencapsulation masked particles and created hidden toxic pathways. Contaminated brood food produced delayed mortality rather than immediate kills.
The federal beekeeper indemnity program once compensated chemical losses, but administrative challenges and disputed claims led to its discontinuation.
The Varroa turning point: beekeeper shift to in-hive treatments
The late 1980s arrival of Varroa mites forced managers to use in‑hive strips. Fluvalinate (Apistan®) was followed by coumaphos (CheckMite+®) and then amitraz (Apivar®).
Resistance emerged and residues built up in comb wax, creating long‑term contaminant stores that affect colony health across years.
| Treatment | Class / mode | Residue behavior | Note |
|---|---|---|---|
| Fluvalinate (Apistan®) | Pyrethroid | Wax‑binding, persistent | Resistance reported after repeated use |
| Coumaphos (CheckMite+®) | Organophosphate (cholinesterase inhibitor) | Accumulation in comb | Worker exposure via stored pollen |
| Amitraz (Apivar®) | Amitraz (formamidine) | Moderate persistence | Continued use as resistance to others grew |
| Aldicarb (Temik®) | Carbamate systemic | Soil and nectar residues; metabolites possible | Metabolites may be more toxic than parent compound |
Cumulative exposure matters: residues from in‑hive insecticides plus agricultural chemicals interact and influence colony resilience today.
For practical reading and further beekeeping resources, this history sets the stage for how neonics became the next major chapter in bee risk.
How neonicotinoids work: Systemic chemistry, persistence, and bee exposure
Seed coatings and soil drenches let neonicotinoids enter plants and reach the parts bees use. Once absorbed, residues move with sap into leaves, flowers, pollen, and nectar. That creates direct dietary exposure for foragers and brood.
Plant-level pathways: Seeds, sap, pollen, and nectar
Systemic uptake means a chemical applied to seed or soil becomes part of the plant’s fluids. Treated corn and soybean seed are common sources.
Residues in pollen and nectar can last months to years, so bees face chronic contact, not just brief contact during sprays.
Environmental pathways: Dust drift, soil residues, and water contamination
Planter dust during sowing can spike nearby exposure and has caused acute kills of foragers in spring. Runoff and leaching move residues to streams and ponds.
Soils can hold residues between seasons, contaminating non-target plants in field margins and extending landscape-level risk.
Neural targets and sublethal effects on navigation and immunity
Neonicotinoid chemicals act at insect nicotinic acetylcholine receptors, altering nerve signaling.
Sublethal doses can impair navigation, learning, and immune response. That reduces foraging success and colony resilience.
“Systemic exposure changes how we must assess risk: chronic and behavioral effects matter as much as short-term kills.”
| Pathway | Typical timing | Common residues | Primary concern |
|---|---|---|---|
| Seed treatment → plant sap | Post-emergence weeks–months | Pollen, nectar | Chronic dietary exposure to foragers and brood |
| Planter dust | Planting events | High short-term spikes | Acute mortality of foragers on nearby flowers |
| Soil & water | Months to years | Detectable in runoff and puddles | Landscape contamination; exposure via drinking water |
| Residue carryover in weeds | Seasonal | Low but persistent | Non-target plants become exposure sources |
Why testing must change: Traditional contact-only assays miss chronic, behavioral, and brood exposures. Modeling and long-term studies give a fuller view of risks to bees and the broader environment.
Quantifying the shift: Agriculture becoming 48 times more toxic to insects
By linking records of what was applied, how long chemicals persist, and residues found in hives, analysts built a landscape‑level toxic load model.
The study used three data streams: national use volumes, environmental persistence metrics, and measured toxin loads in honey bee tissues. Combining these allowed estimation of cumulative harm across crops and seasons.
Measuring persistence matters because long‑lived residues carry exposure across rotations and years. That sustained presence increases chronic dietary risk for foragers and brood.
Why neonics drove the trend
Key drivers: high insect potency, systemic uptake into pollen and nectar, and broad adoption as seed coatings—especially in corn and soy—explained most of the rise. Between 1992 and 2014 neonics accounted for about 92% of the increased toxic load.
“Switching chemistries shifted exposure from brief contact to continuous oral intake via plant tissues.”
| Data input | Role in model | Implication |
|---|---|---|
| Use volumes | Maps application intensity by crop | Identifies high‑use hotspots |
| Persistence (half‑life) | Weights long‑term exposure | Shows seasonal carryover risk |
| Hive residues | Validates exposure pathways | Links model to real bee outcomes |
Models carry uncertainties in half‑life and residue transfer. Still, the analysis aligns with field reports and points to the need for standardized data and targeted management. For a deeper review of the science guiding policy, see this summary of the science.
Crops, seeds, and application methods that elevate bee risk
Different crops and application tools create distinct exposure windows for bees. Large-acreage seeds treated for corn and soybeans pose acute hazards at planting. Treated seeds are common for many crops, including canola, sunflower, and cereal grains.
Seed coatings and planter dust
Abrasion during sowing produces fine dust that can drift onto nearby flowering plants. That dust contains active ingredients that can kill foragers during corn planting events.
Foliar, soil, and trunk methods
Foliar sprays and soil drenches in fruits and vegetables can leave residues in pollen and nectar during bloom. Trunk injections and bark sprays move compounds into xylem and may persist through seasonal flowering.
- Timing: Seed planting gives short, high‑intensity exposure; systemic tree work and drenches create longer, lower‑level exposure.
- Variability: Crop species, cultivar, and farm practice change residue levels in field forage.
- Mitigation: Match application timing to local bloom, remove flowering weeds prior to work, and use validated planter lubricants or retrofit kits to reduce dust.
Surface runoff from treated fields can spread residues into waterways and non‑crop plants, extending exposure beyond the treated field and shaping where bees forage.
Field reports from U.S. beekeepers: “Mad Bee Disease,” colony losses, and timing
Beekeeper logs from the early 2000s recorded sudden changes in forager behavior that matched the calendar for large-row crop planting.
Reports described a syndrome called “Mad Bee Disease” with impaired homing, tremors, and lethargy. These signs are consistent with neurotoxic effects seen at sublethal and lethal doses.
Steve Ellis documented massive bee kills during corn planting when treated seed dust drifted onto willow and other nearby blooms. Those events caused instant mortality as bees foraged.

Commercial migratory operators reported two patterns: localized, episodic mortality spikes tied to planting, and broader seasonal declines that reduce colony strength over a year.
Beekeepers noted roughly 40% colony loss in the 2018–2019 year, and many described chronic weakened colonies after exposure, which affected pollination contracts.
- On-the-ground logs, photos, and incident reports helped build evidence that complements formal study.
- Outcomes vary by region, crop mix, and nearby forage availability.
- Harmonized incident reporting linking timing, product, and weather would improve targeted responses.
“Field observations show acute kills and lingering colony decline that together shape commercial losses.”
CCD-era context: Multifactor stressors and where pesticides fit
Bees today face a suite of pressures that interact in ways that make causation difficult to untangle. The USDA/EPA (2013) concluded that pests, diseases, nutrition, habitat, genetics, chemicals, and management all shape hive outcomes.
Diseases, parasites, nutrition, habitat, and management interactions
Complex drivers behind colony declines
Varroa mites and viruses remain central threats that weaken honey bee colonies and spread pathogens. Poor nutrition from limited floral diversity reduces immune response and overwinter survival.
Sublethal exposure to agricultural chemicals can reduce disease resistance and impair foraging. That makes colonies less able to survive cold or dearth periods.
Overwinter losses versus sudden collapses
Since 2006, overwinter losses have averaged near 30% in many surveys. In 2012–2013, more hives dwindled gradually than showed classic sudden colony collapse with vanishing adults.
“Multiple interacting factors rather than a single cause best explain modern colony loss patterns.”
- Management moves—migration, feeding, and biosecurity—alter exposure and recovery paths.
- Additive effects among in-hive treatments, agricultural residues, and pathogens can magnify harm.
- High-quality, diverse forage and landscape choices improve resilience for pollinators and colonies.
- Data gaps for wild bee populations mean we should not directly extrapolate honey bee trends to all native species.
| Stressor | Typical effect | Management response |
|---|---|---|
| Varroa & viruses | Brood loss, weakened immunity | Regular mite control, monitoring |
| Poor nutrition | Reduced overwinter survival | Diverse forage, targeted supplemental feeding |
| Chemical exposure | Sublethal behavior changes, mortality spikes | Timing adjustments, buffer zones, product choice |
| Habitat loss | Lower population density, limited forage | Habitat restoration, planting pollinator strips |
What this means: addressing hive declines requires integrated strategies that combine strong parasite control, better forage and habitat, and careful chemical stewardship. Policy and risk assessment should reflect these complex interactions rather than seeking a single cause.
Regulatory foundation: How the EPA evaluates pesticide risks to pollinators
Federal statutes set the stage for how the agency assesses risk to bees and other pollinators. Under FIFRA, the EPA registers products and enforces label directions to prevent unreasonable adverse effects. For food uses, the Food, Drug, and Cosmetic Act (FFDCA) lets EPA set tolerances to ensure residues in food meet safety standards.
The registration process requires manufacturers to supply data on environmental fate, exposure pathways, and toxicology. Acute LD50 tests for bees are standard. The agency also collects incident information from beekeepers and the public to detect real-world harms.
What data and mitigations matter
EPA reviews studies that include acute, chronic, and sublethal endpoints when warranted. Labels may carry mandatory mitigations such as timing restrictions, buffer zones, and specific application methods to lower risks to bees in bloom.
“Labels translate scientific findings into enforceable practices that growers and applicators must follow.”
- Registration scope: evaluates environmental fate, residue carryover, and pollinator toxicity.
- Incident role: reported bee mortality can trigger label changes or expedited reviews.
- Use authorizations: Section 3 registrations are routine; emergency or conditional permits alter oversight and may carry extra limits.
| Regulatory element | Primary focus | Pollinator consideration | Outcome |
|---|---|---|---|
| FIFRA registration | Product safety and labeling | Requires bee toxicity and exposure data | Approved uses and enforceable labels |
| FFDCA tolerances | Residues in food | Human safety; indirect link to use patterns | Limits on residue levels in commodities |
| Incident reporting | Real-world effects | Detects acute bee kills and chronic issues | May prompt reevaluation or label revisions |
| Review cycles | Periodic reassessment | Incorporates new chronic/sublethal data | Restrictions, cancellations, or updated mitigations |
Looking ahead: risk assessment is shifting beyond single-dose LD50s to include chronic exposure, brood effects, and landscape modeling. These tools aim to better align regulation with real-world bee exposures and to guide on-farm practices that reduce harm.
Risk assessment advances: From LD50 and LC50 to PEC/PNEC for bees
Modern assessments move beyond single-dose toxicity to weigh realistic exposure across colony members.
Traditional LD50 and LC50 tests capture short-term lethality but miss chronic, developmental, and behavioral effects that shape colony outcomes. Those metrics are useful for acute screening yet underestimate harms from repeated, low-dose dietary exposure.
Exposure modeling for hive bees, foragers, and brood
The Predicted Exposure Concentration (PEC) / Predicted No Effect Concentration (PNEC) framework compares expected residues in pollen and nectar with thresholds derived from acute, chronic, and sublethal endpoints. A French assessment applied this method across adult hive bees, foragers, and brood and found PEC/PNEC ratios above one flagged high concern for adult hive bees in sunflower and maize regions after imidacloprid adoption in 1994.
Model inputs include:
- Residue concentrations measured in nectar, pollen, and wax.
- Diet composition and consumption rates by cohort.
- Seasonal foraging patterns and colony demographics.
- Sublethal endpoints such as navigation, foraging efficiency, and brood care used to set PNEC with safety factors.
Interpreting ratios greater than one: What “alarming risk” means in practice
PEC/PNEC > 1 indicates potential for adverse effects under realistic field scenarios. Such signals support management triggers: avoid applications during bloom, revise seed treatment use, or strengthen buffer measures.
“PEC/PNEC ratios that exceed unity provide an early warning aligned with beekeeper reports from affected growing regions.”
To reduce uncertainty, regulators and growers need robust residue monitoring, validated exposure models, and integration of incident data to calibrate predictions. This approach helps translate risk assessment into targeted label language and practical mitigations for high-risk crops and periods.
Inside the hive: Varroa control chemicals and additive effects on bee health
Managing Varroa required new tools, but those tools introduced their own tradeoffs for hive resilience.
Beekeepers adopted in‑hive insecticides beginning with fluvalinate (Apistan®), then coumaphos (CheckMite+®), and later amitraz (Apivar®). Each product provided useful mite control at first, but repeated use selected resistant mite populations and reduced long‑term efficacy.
Fluvalinate, coumaphos, amitraz: efficacy, resistance, and residues
Modes of action and toxicity: fluvalinate is a pyrethroid targeting nerve function; coumaphos is an organophosphate and cholinesterase inhibitor with higher mammalian toxicity; amitraz acts on octopamine receptors and remains a widely used option.
Residues from these products bind into wax and persist. That accumulation exposes brood and nurse bees over multiple seasons and can reduce colony health even when external pesticide pressure is low.

“Residue build‑up in comb changes the chemical environment for developing brood and can magnify sublethal effects.”
| Product | Class / target | Residue behavior | Management note |
|---|---|---|---|
| Fluvalinate (Apistan®) | Pyrethroid / mite neurotoxin | Wax‑binding, long persistence | Rotate to avoid resistance |
| Coumaphos (CheckMite+®) | Organophosphate / cholinesterase inhibitor | Accumulation in comb; higher mammal toxicity | Use with caution; monitor residues |
| Amitraz (Apivar®) | Formamidine / mite neuroregulator | Moderate persistence; detectable in wax | Effective but resistance reported; follow label |
“Soft” acids and essential oils: benefits, limits, and colony stress
Organic acids and thymol‑based products (formic, oxalic, thymol) offer lower residue profiles in comb and can reduce chemical load. They still require careful timing and temperature windows to avoid harming queens or stressing bees.
These options work well inside an integrated pest management (IPM) plan that includes mite monitoring, comb rotation, and technique variety. Many managers adopt plastic foundation or replace old comb to lower legacy residues.
- Monitor mite counts and rotate treatments to slow resistance.
- Use comb replacement or plastic foundation to reduce wax reservoirs.
- Follow labels strictly for timing and dosage to limit colony stress.
Why this matters: in‑hive products interact with residues carried in from the landscape. Additive or synergistic effects can amplify harm to colonies, so chemical stewardship and non‑chemical tactics are essential for long‑term colony health and resilience.
For research on interacting stressors and colony outcomes, see a detailed review at recent peer‑reviewed analysis.
Evidence landscape: Studies, data gaps, and mixed findings in pollen and nectar
Sampling programs and targeted trials show variable results when testing flower parts and hive stores. Results depend on when samples were taken, what analytical limits were used, and which crops or habitats were sampled.
Detection limits matter. A Canadian study (2001–2002) found no detectable imidacloprid or major metabolites in clover, wildflowers, bee-collected pollen and nectar, and uncapped honey after in‑furrow use, but the detection threshold was 2 ppb. That limit can mask lower concentrations that still produce chronic or behavioral effects over years.
Detection limits, metabolites, and variability
Metabolites complicate interpretation. Some breakdown products can be as toxic as—or more toxic than—the parent chemical (for example, aldicarb metabolites). Monitoring that ignores metabolites may understate real risk to foragers and brood.
Evidence also varies by crop, application method, soil, climate, and season. PEC/PNEC assessment in other work found ratios above one for imidacloprid in sunflower and maize areas, aligning with field observations of harmed colonies.
| Topic | What studies report | Key caveat |
|---|---|---|
| Residue detection | Some studies show non-detects; others record measurable residues | Depends on timing and analytical limits (e.g., 2 ppb) |
| Metabolites | Can be present and toxic | Often under-tested in pollen and nectar assays |
| Risk signals | PEC/PNEC > 1 in certain crops | Matches some field reports of bee harm |
What is needed: independent, long-term, multi-crop monitoring with standardized methods for pollen and nectar. Studies should pair residue data with colony health, foraging behavior, and transparent funding to build trust and clearer information for assessment.
“Linking residue studies to colony metrics and behavior will improve ecological relevance and guide practical responses.”
Policy trajectory: EU bans, U.S. product restrictions, and legislative proposals
Regulatory choices have split globally, with the European Union taking a precautionary route while the United States has used targeted cancellations and label fixes.
The EU banned the most hazardous neonicotinoids in 2018 after risk assessments found high threats to pollinators and wild insects.
In contrast, the EPA’s May 2019 actions canceled 12 specific neonic products and required label changes for others, rather than a class‑wide ban. That narrower approach left many retail and seed treatments in circulation.
Legislative and market responses
The Saving America’s Pollinators Act (introduced February 2019) proposes a full ban on neonicotinoids in the united states, which would force shifts in crop protection strategies and seed supply chains.
Stakeholders differ: beekeepers and environmental groups favor broad restrictions; many growers and manufacturers warn of limited alternatives for systemic control of sap‑feeding pests.
- Regulatory divergence affects trade, seed availability, and integrated pest management options.
- States and cities are filling gaps with local measures that add protections for urban and rural bees.
- Home and garden uses remain part of the exposure picture and may face future curbs if science supports restrictions.
“Evolving risk management will likely blend enhanced modeling, incident tracking, and seasonal limits tied to bloom and planting windows.”
For further context and policy timelines, see this EU review of the ban and post‑decision coverage.
Economic and ecological stakes: Pollination services, food systems, and biodiversity
Pollination underpins roughly three-quarters of crop types that produce fruits, nuts, and many vegetables. That service links farm yields to healthy pollinators and stable bee populations that growers rely on each season.
When managed colonies decline, growers face higher pollination fees and tighter supply chains for specialty crops. Increased rental costs and lost contracts translate to real losses for beekeepers and farmers.
Ecologically, rising insect toxic load harms non-target species, alters food webs, and reduces prey availability for birds and other wildlife.
Wild bee declines add pressure by removing backup pollination services that once buffered farms. Regional hotspots with intense specialty production show the greatest mismatch between demand and available pollination.
- Economic risk: higher costs, fewer pollination options, and supply volatility for food markets.
- Ecological risk: fewer species, disrupted plant reproduction, and cascading biodiversity loss.
- Resilience paths: habitat restoration and diverse forage reduce vulnerability and support pollinator health.
“Protecting pollinators is essential to secure food systems and preserve ecosystem services.”
Public‑private partnerships that invest in pollinator‑friendly practices deliver co-benefits for soil, water, and wildlife and help sustain resilient agriculture for the future.
Best management practices to reduce bee exposure in U.S. agriculture
Practical farm steps lower exposure pathways while keeping crop protection effective. These measures cut acute kills from planting dust and reduce chronic residues that affect foragers and brood.
Seed, planter and timing controls
Planter setup matters: use deflectors, calibrated equipment, and seed lubricants to limit dust from treated seed during sowing. Adjust application timing to avoid bloom and peak foraging. Remove flowering weeds before work when feasible.
IPM, alternatives, and landscape safeguards
Integrated pest management favors monitoring and thresholds so growers only apply chemical controls when needed. Evaluate lower‑toxicity products and application forms with shorter persistence to lower site-level risk.
- Establish buffer zones and drift-reduction technology to protect non-target plants and field margins.
- Protect water by avoiding treatments before rain, using vegetative strips, and following EPA label mitigation to prevent runoff.
- Coordinate schedules with local beekeepers and track outcomes with residue checks and incident reports.
- Enhance habitat—cover crops and hedgerows—to dilute exposure and improve nutrition for bees.
| Measure | Primary benefit | Practical note |
|---|---|---|
| Planter deflectors & lubricants | Reduce dust spikes in field | Simple retrofit; follow manufacturer guidance |
| Timing applications | Lower direct contact to foragers | Avoid bloom and peak bee activity |
| Buffers & vegetative strips | Protect plants and water | Also support pollinator nutrition |
For seasonal coordination and hive protection tips, see seasonal beekeeping tasks.
48. pesticide impact on U.S. beekeeping: What the past tells us about the future
The record shows a clear shift: product form and use patterns converted brief exposure events into chronic dietary routes that follow colonies through forage and water.
Historical lessons link arsenic dust, microencapsulated sprays, and seed treatments to changing exposure for bees. Varroa-era in-hive treatments added a legacy chemical load that combines with field residues.
Risk assessment advances—like PEC/PNEC and chronic endpoints—help translate science into labels and practices that better protect colonies during peak planting time.
“Coordinated action across growers, beekeepers, regulators, and manufacturers is essential to reduce peak risk periods.”
Moving forward means diversifying IPM, managing resistance, improving incident reporting, and expanding monitoring for metabolites and mixtures. Water and habitat safeguards will remain key as systemic residues travel through landscapes.
- Priority: reduce chronic exposure and strengthen nutrition to boost resilience.
- Research need: study additive effects between in-hive and field chemicals.
- Policy path: align assessment tools with real-world practice to trigger timely mitigations.
Conclusion: the 48-fold rise in insect toxic load over recent years is a guidepost. Use it to pivot toward safer, more sustainable agriculture and healthier bees.
Methodological notes for trend analysis: Timeframes, products, and environments
This methods note summarizes how the study assembled and compared records to map change from 1992–2014. The core approach linked historical use volumes, environmental persistence estimates, and measured residues in hive matrices to create a comparable toxic load metric.
Data sources included federal and state application records by active ingredient, published half‑life and mobility parameters, and targeted residue analyses from bee tissues, pollen, and wax. The analysis combined potency, persistence, and use intensity into a single index so years and crops could be compared.
Assumptions and limits: residue variability, missing metabolite data, and mixtures are noted as constraints. Representative environments covered large-acreage seed treatments (corn, soy) and specialty crops with foliar or soil treatments.
Field reports and incident logs were used to ground‑truth model signals. Sensitivity checks identified which inputs most influenced the trend, and uncertainty ranges guided interpretation.
“Transparent methods and standardized reporting across states will improve assessment relevance for regulators and managers.”
- Encourage harmonized reporting and expanded monitoring.
- Future work: add wild pollinator models and landscape features to refine exposure estimates.
Conclusion
In short, the evidence shows major shifts in how colonies meet chemical residues. Data link a large rise in insect toxic load—driven largely by systemic neonics—with new chronic dietary exposure and sharp planting‑time dust events that kill foragers.
Bees and other pollinators now face combined stresses: disease, poor nutrition, and chemical exposure that together weaken colony health. Field reports and loss records amplify model findings and point to real-world harm.
Regulators are updating risk tools, and growers can cut risk through IPM, timing controls, and habitat restoration. Continued monitoring, transparent information, and stakeholder collaboration will help reduce chronic exposure, prevent acute incidents, and support resilient crops and thriving bee communities.
FAQ
What is the relationship between neonicotinoids and honey bee colony health?
Neonicotinoids are systemic insecticides that can appear in pollen and nectar. Acute exposure can kill foragers, while repeated sublethal doses can impair navigation, learning, and immunity. These effects increase colony stress and can interact with pathogens, parasites, and poor nutrition to raise the risk of overwinter losses and reduced honey production.
How do bees encounter chemicals applied to crops and seeds?
Bees encounter residues through multiple plant-level and environmental pathways: treated seed coatings can create planting-time dust; systemic uptake deposits residues in sap, pollen, and nectar; and soil or water contamination creates indirect exposure. Drift from foliar sprays and residues in nearby wildflowers add to the overall load bees face in agricultural landscapes.
What evidence supports the claim that agriculture has become more toxic to insects over time?
Comparative analyses use product use patterns, persistence metrics, and honey bee toxicity values to calculate insect toxic load. Studies show that the introduction and widespread use of long‑lasting systemic compounds, especially neonicotinoids, drove a large increase in estimated toxicity per hectare compared with older contact insecticides.
Do in-hive treatments for Varroa mites affect hive chemistry and bee health?
Yes. Miticides such as fluvalinate, coumaphos, and amitraz leave residues in wax and brood comb. These residues can stress bees, reduce detoxification capacity, and interact with other chemicals, potentially worsening effects from agricultural exposures. Alternative controls like organic acids and essential oils reduce some risks but have limits in efficacy and application consistency.
How does the EPA evaluate risks to pollinators when registering products?
The EPA uses toxicity testing (e.g., acute LD50, chronic studies) and exposure modeling for foragers, nurses, and brood. It assesses inhalation, dietary, and contact routes, plus incident data. Newer approaches include comparing predicted environmental concentrations (PEC) to no-effect concentrations (PNEC) and modeling exposure from systemic residues in nectar and pollen.
What are the main data gaps in pollen and nectar monitoring?
Gaps include limited multi-year sampling across crop types, inconsistent detection of metabolites, variable analytical limits, and poor geographic coverage. That variability makes it hard to generalize exposure levels for different landscapes and flowering periods.
Are seed treatments a major source of acute bee mortality during planting?
Yes. Improperly managed seed coatings on corn and soybeans can produce abrasive dust during planting. That dust can kill nearby bees if planter technologies and seed lubrication practices aren’t used or if buffer zones are absent. Managing planting equipment and timing can greatly reduce this risk.
How do sublethal effects translate into colony-level outcomes?
Sublethal impacts—on navigation, foraging efficiency, learning, and immune function—reduce food intake and increase disease susceptibility. Over time, these impairments can lower brood rearing and winter survival, contributing to higher colony loss rates even absent mass mortality events.
What management steps can growers and applicators take to lower risk to pollinators?
Use integrated pest management (IPM) to avoid unnecessary treatments, choose less persistent chemistries when possible, apply during times when bees are inactive, maintain buffer zones, adopt seed lubrication and improved planter technologies, and protect water and non-target plants. Communication with local beekeepers about application timing also helps.
How have policy responses differed between the U.S. and the EU regarding systemic insecticides?
The EU has taken broader action, restricting high‑risk neonicotinoids for many outdoor uses. The U.S. relies on EPA risk assessments and label mitigation; regulatory moves include product-specific restrictions and updated testing requirements. Legislative proposals like the Saving America’s Pollinators Act aim to tighten controls but face varying political and stakeholder views.
What role do pathogens and habitat loss play alongside chemical exposure?
Diseases (e.g., Nosema spp.), Varroa mites, poor nutrition from habitat loss, and chemical exposure form a web of stressors. These factors interact synergistically: weakened immunity from chemical stress can amplify pathogen impacts, while limited forage reduces resilience to all stressors, increasing the likelihood of colony decline.
How should beekeepers report and document chemical incidents affecting hives?
Keep detailed records: dates, hive losses, visible symptoms, nearby applications, product names, and applicator contact info. Submit incident reports to state agencies and the EPA where appropriate. Collecting dead bees, providing samples to diagnostic labs, and coordinating with local extension services improves response and helps build the evidence base.
Can residue levels in honey and wax pose risks to human consumers?
Regulatory tolerances aim to keep residues in food below safety thresholds. However, wax often contains higher, persistent residues that can affect brood and nurse bees more than human consumers. Monitoring programs and good hive hygiene reduce potential contamination in honey and other products.
What research or monitoring would best improve risk assessments for pollinators?
Consistent multi-year field studies across diverse cropping systems, improved detection of metabolites, landscape-level exposure modeling, and long-term colony health monitoring would inform better PEC/PNEC ratios. Integrating beekeeper-collected data and incident reports strengthens real-world assessments.